Container yard parametric generation
Introduction
One of the directions for seaports design method development is parametric design [1-3]. This approach considers mathematical relations between objects that set design constraints. The idea here is that instead of creating a technical drawing port designer aims to create a parametric model of the object to:
- find optimal solution for some of the model parameters;
- provide more profound sensitivity analysis for the developing object and see, how the whole project will change in case of increase or decrease of some parameters;
- save drafting time.
Development of such models is a separate direction of port designers’ activity as it requires to parametrize almost every element of the object.
One of the most important elements of a container terminal is a container yard, where containers are stored until they will be loaded on a mode of transport. Therefore, this article is dedicated to the development of container yard parametric model. In order to make material clearer the text will consider only dry containers, without losing method’s generality.
Model constraints
Whether the project is a brownfield or a greenfield one, a container terminal is set to a constrained area, which includes buildings, equipment, railways, quays and containers yard [4-5]. Although it would be great to place container stacks to every inch of a terminal, in order to transfer containers from and to container yard a terminal needs road on the side of the container yard. Roads location depends on the container terminal handling system, i.e container handling equipment.
A container yard consists of container stacks (Fig. 1).
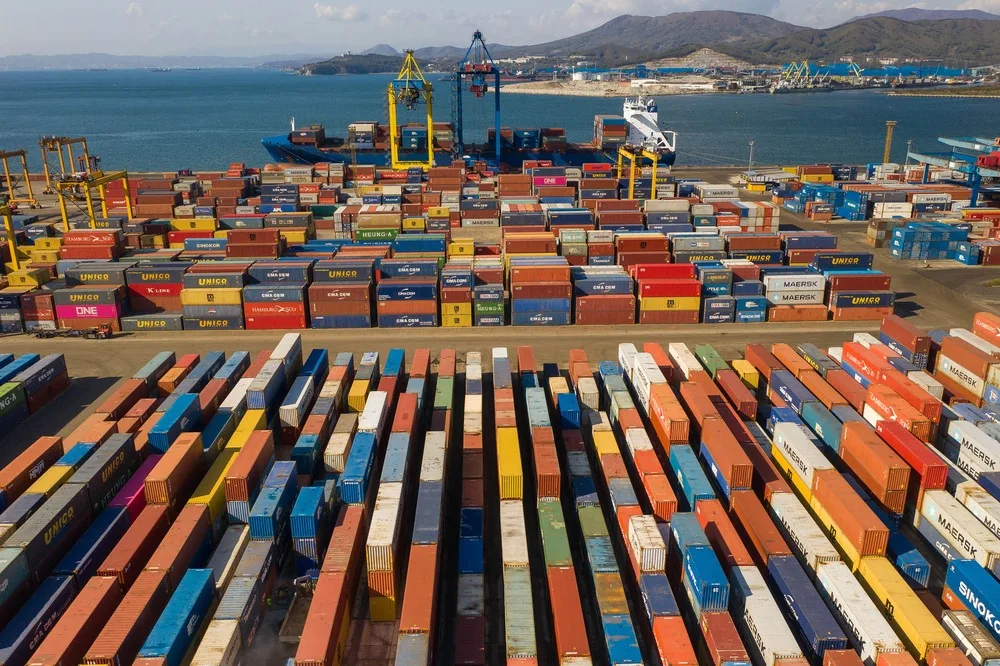
Therefore, the container yard configuration is primarily defined by the direction of container stacks. One of the most popular classifications of container yard configuration is represented by J.P. Rodrigue and T. Notteboom, who identified configuration for automated and conventional container terminals (Fig. 2).
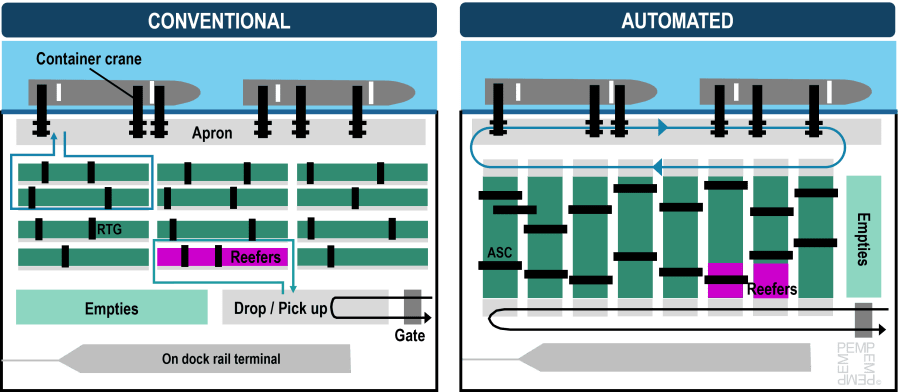
Difference between these two configurations is defined by the engineering desire to separate automated transport and manual one.
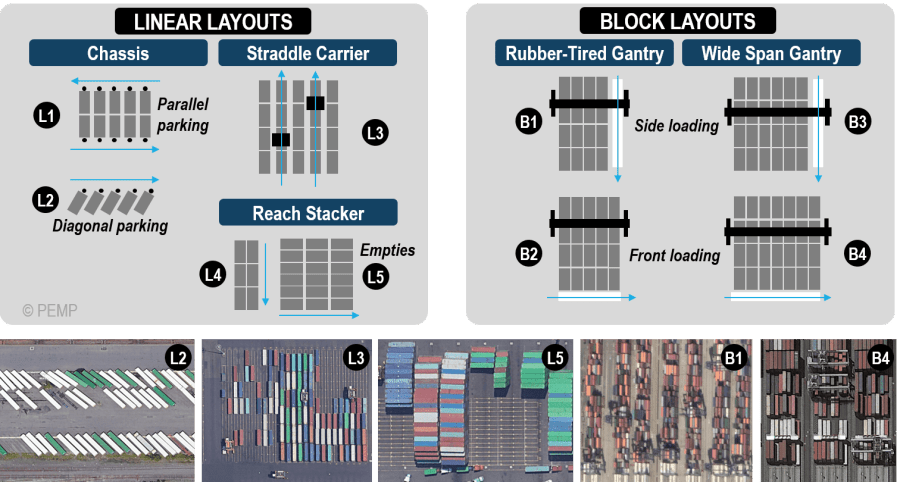
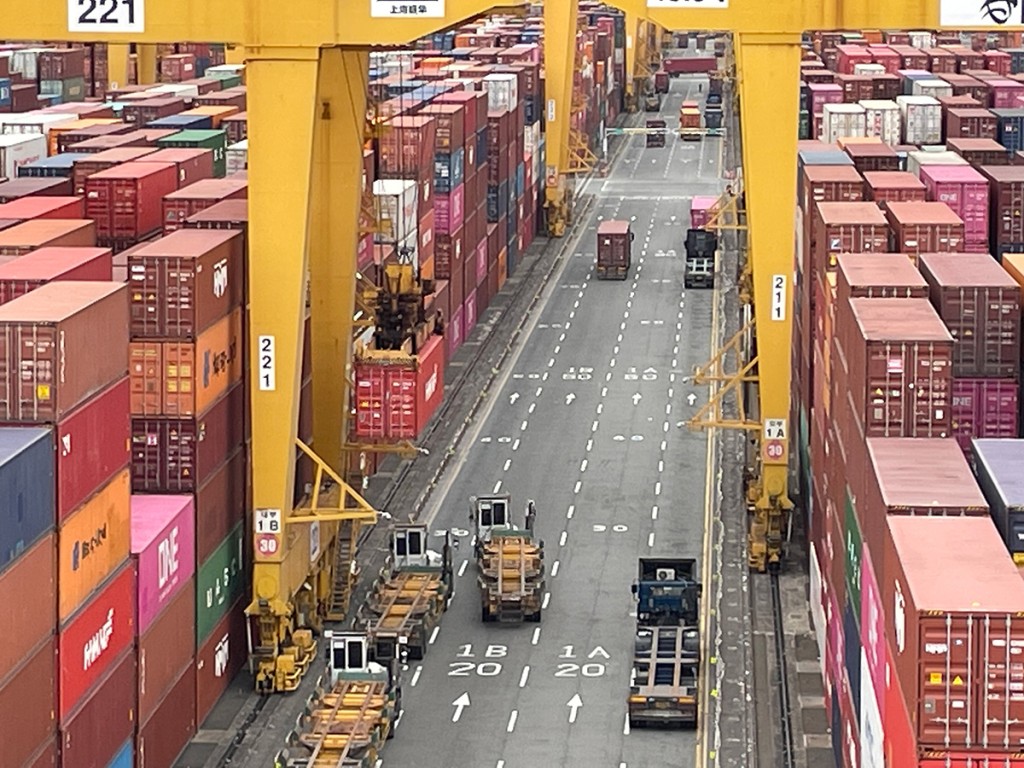
Moreover, a container yard needs roads for vehicle and aisles for container equipment movement. Therefore, container stacks are separated by the transport roads. Each road consists of: terminal equipment road, trucks road and lighting systems (Fig. 3).
Sometimes this distance can include pedestrian passage and road separators (Fig. 4).
In order to speed up container transportation, container yard is separated into blocks of stacks. The blocks are divided by perpendicular roads that allow container handling equipment to move freely among blocks and decrease fire extension risks in case of emergency (Fig. 5).
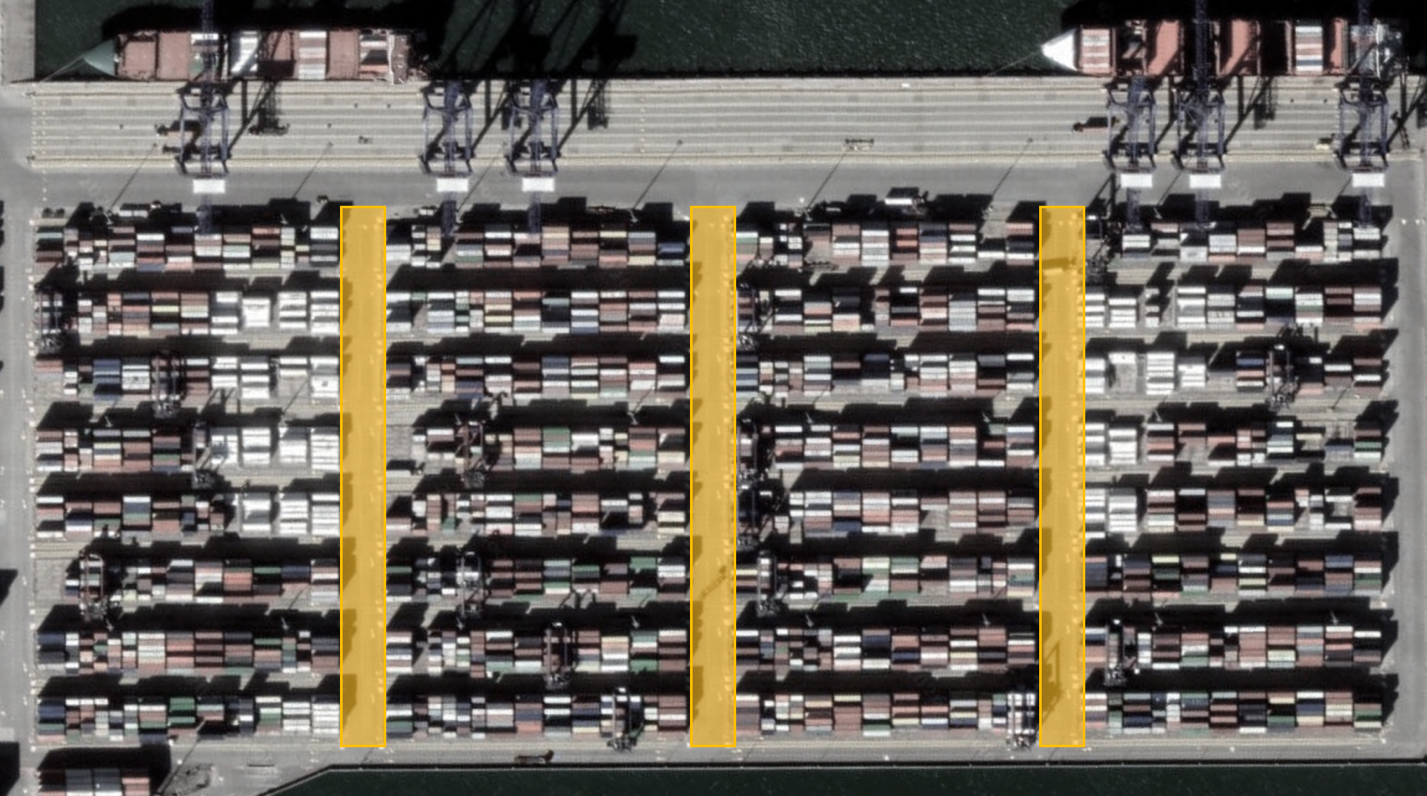
If such roads did not exist it would take more time for a container terminal transport equipment to move among stacks. The number of such passages and distance among them is one of the questions of container yard design.
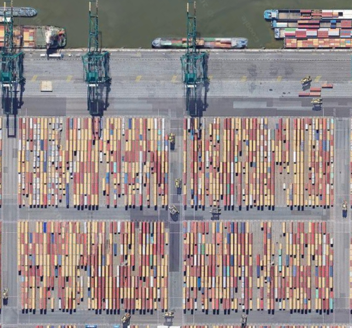
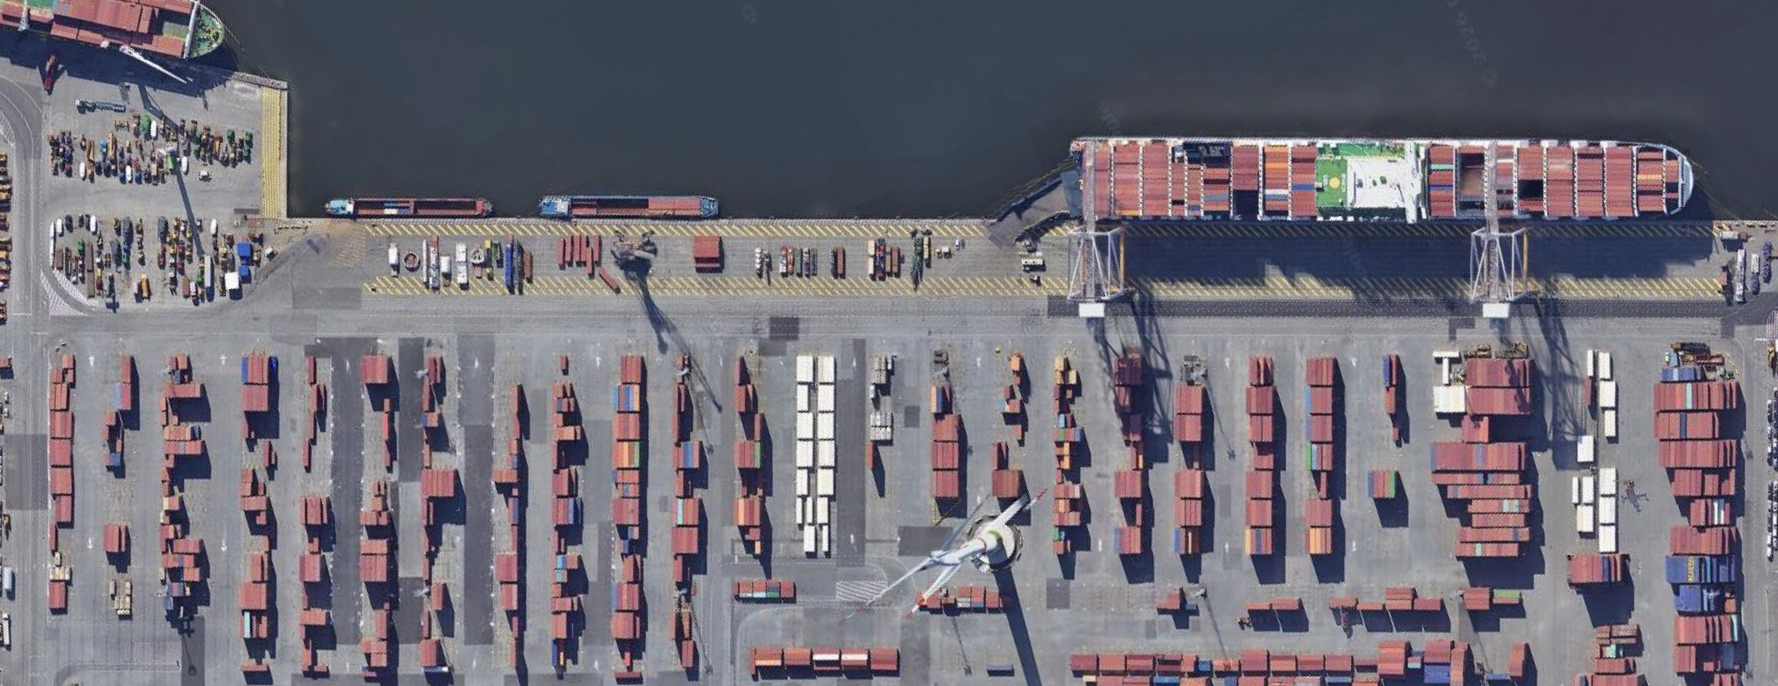
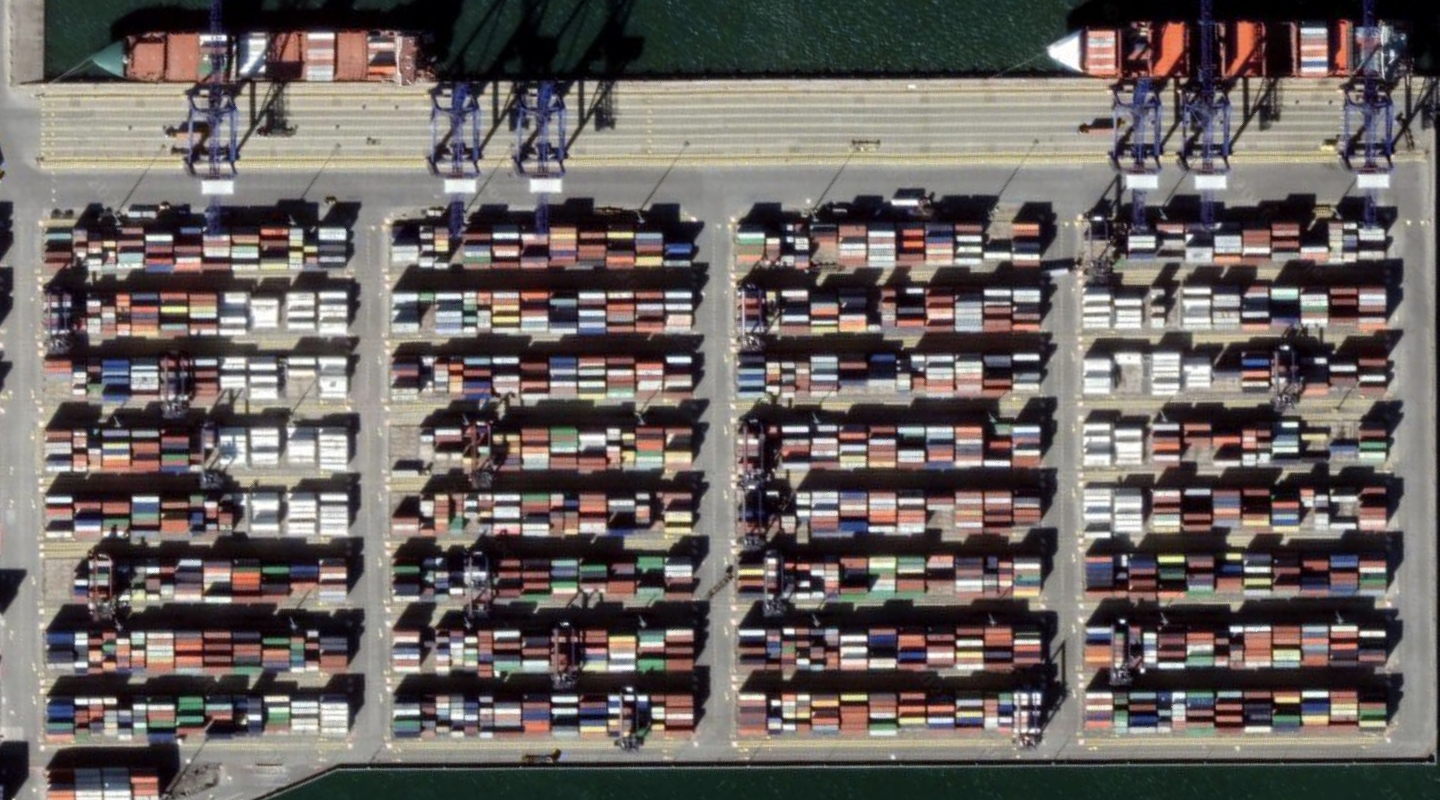
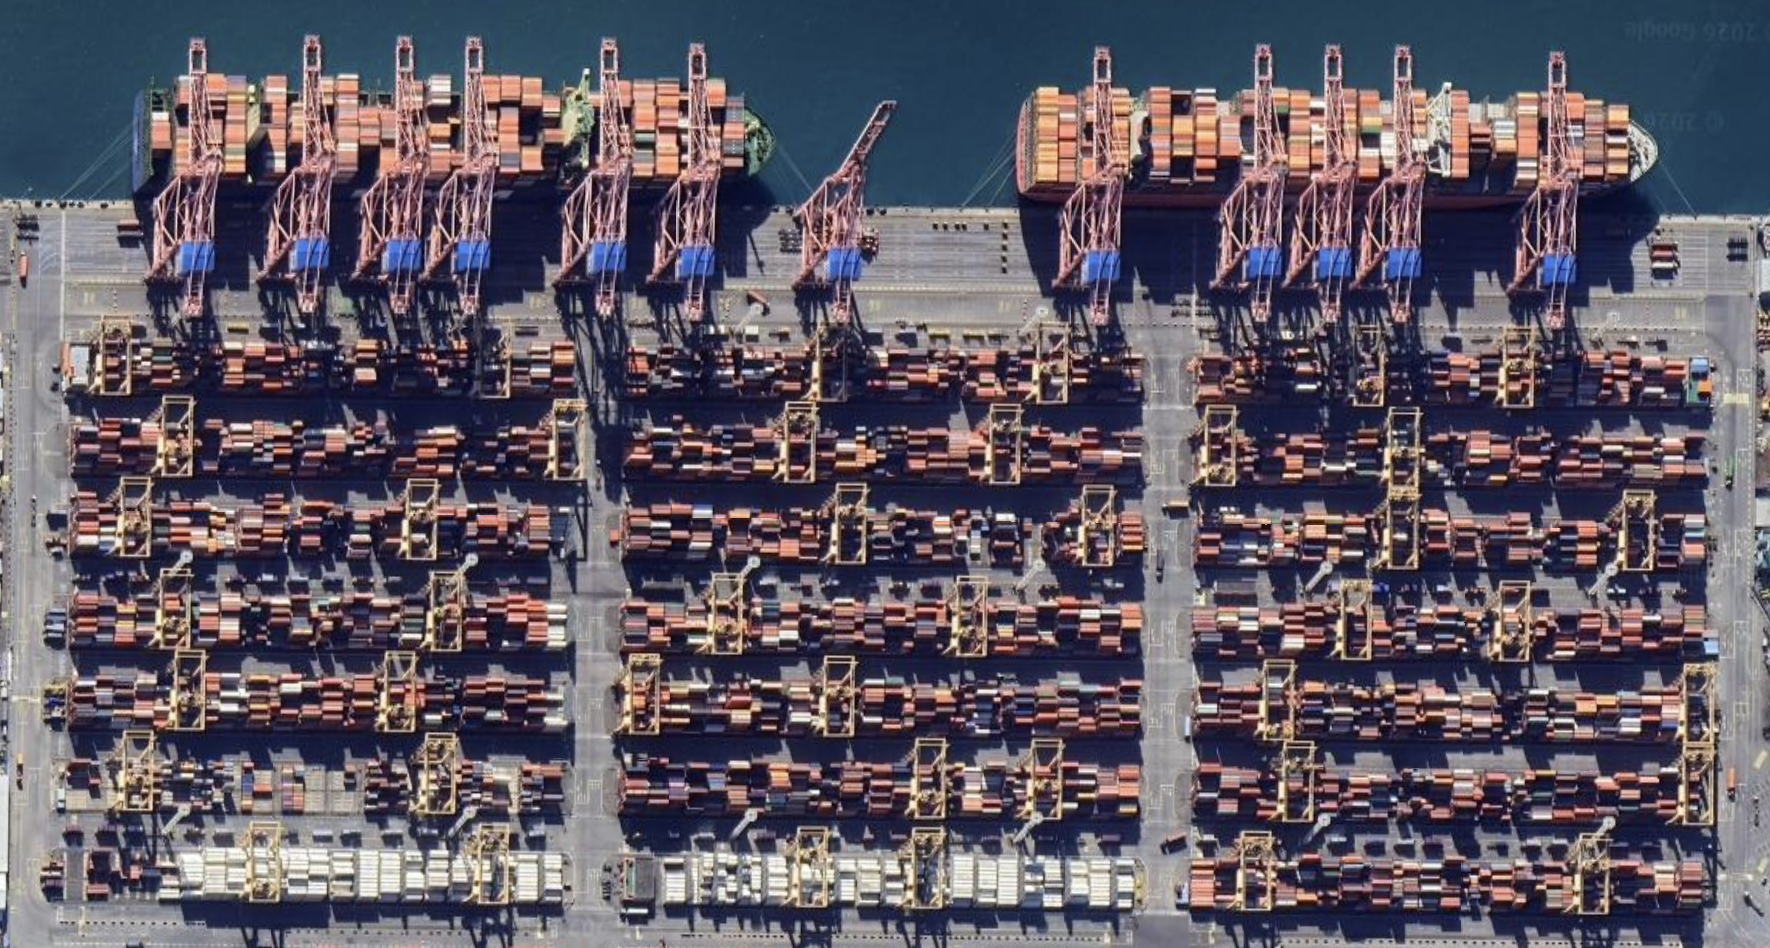
Possible configurations of container yard for different types of equipment are represented in Tab. 1.
Table 1. Direction of container stacks for different container handling systems [7-9]
| # | Equipment | Container yard configuration | Example |
| 1 | Straddle Carrier | 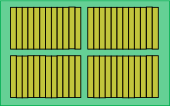 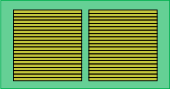 |
 Antwerp 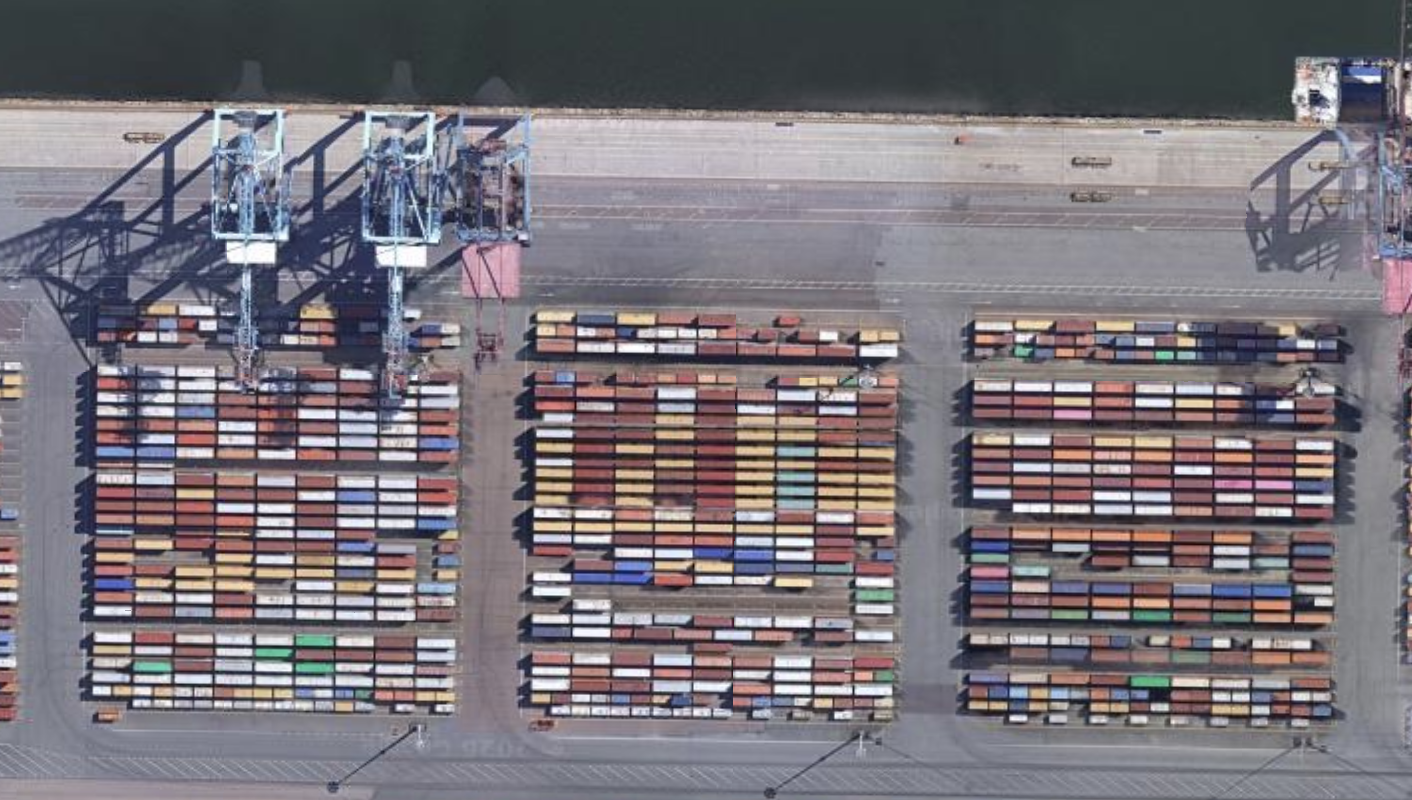 Gotteburg |
| 2 | Reachstacker | 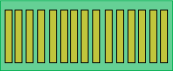 |
 Antwerp |
| 3 | Rubber Tyred Gantry Crane | 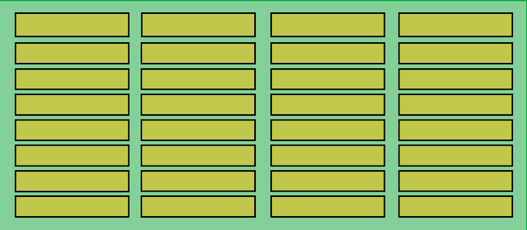 |
 Gdansk |
| 4 | Rail Mounted Gantry Crane | 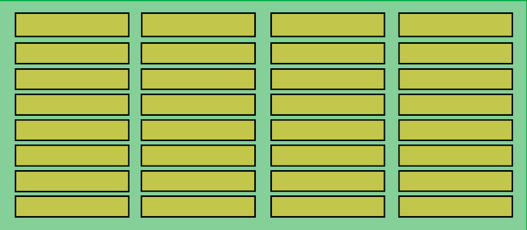 |
 Busan |
| 5 | Automated stacking crane | 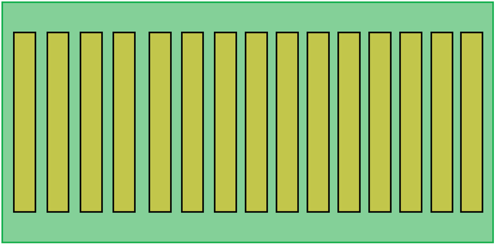 |
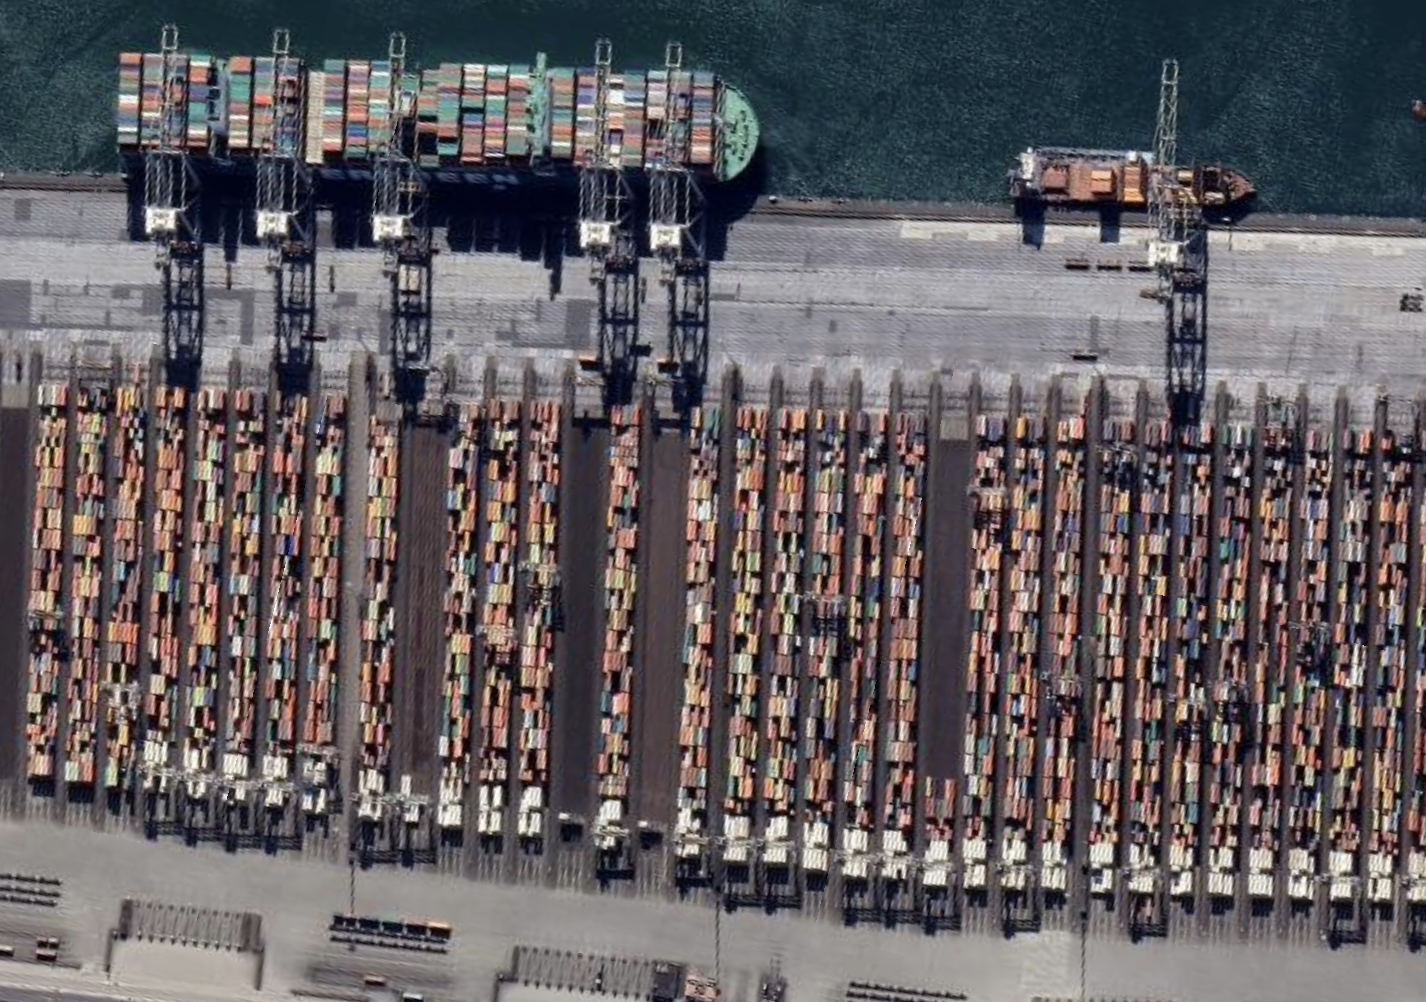 Rotterdam |
Space for the road in the container yard perimeter and within the container yard is defined by the terminal handling equipment.
Each container block consists of stacks, which include bays. Between every two bays there is a distance necessary to provide container handling operations [10]. Every bay consists of rows, which are also separated by a certain distance, that is defined by container handling equipment.
Typical or example spacing is represented in professional publications by PIANC and UNCTAD [11]. Developed software considers the represented configurations for container handling equipment and typical spacing between container yard elements.
Most of the terminals have a standard configuration with container stack placed in accordance with most effective way of container handling equipment (Tab. 2).
Table 2. Examples of simple container yard configurations
| Port | Container handling system | Example |
| Dubai | RMG | 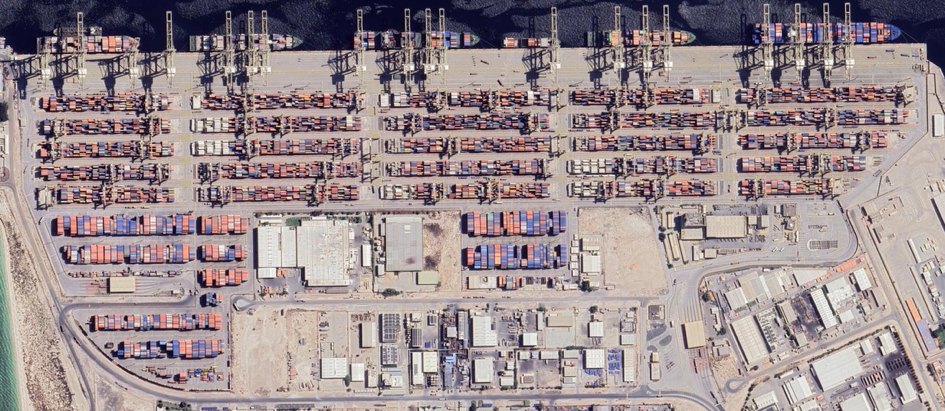 |
| Los Angles | RTG | 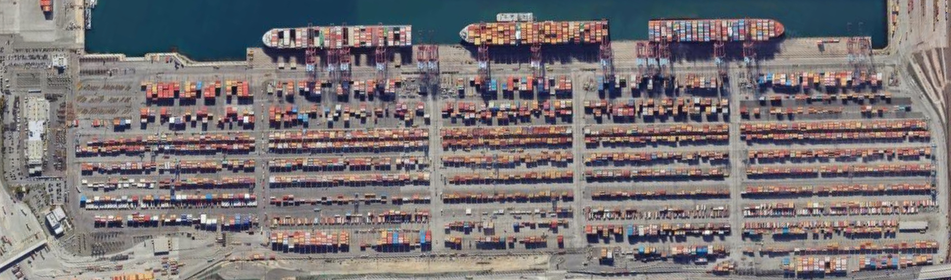 |
| Laem Chabang | RTG | 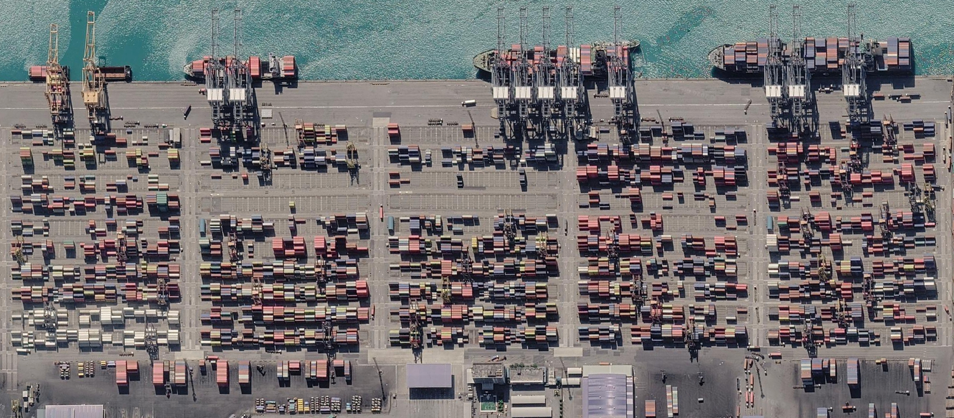 |
| London | ASC | 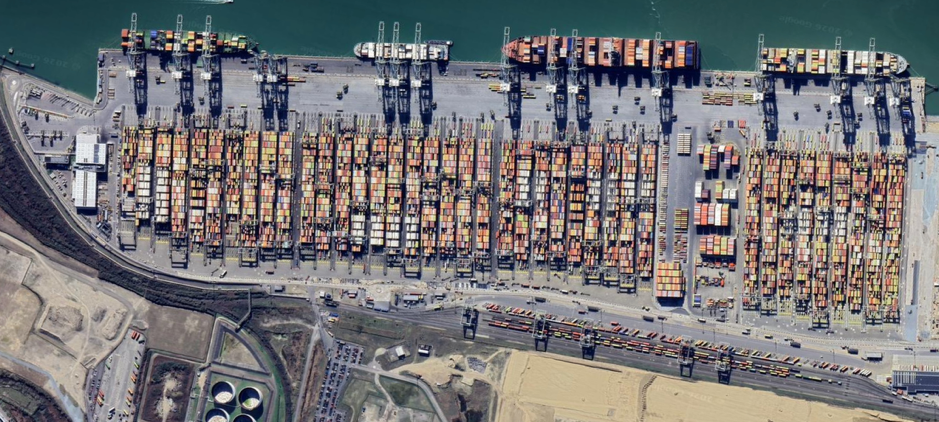 |
| Rotterdam | ASC | 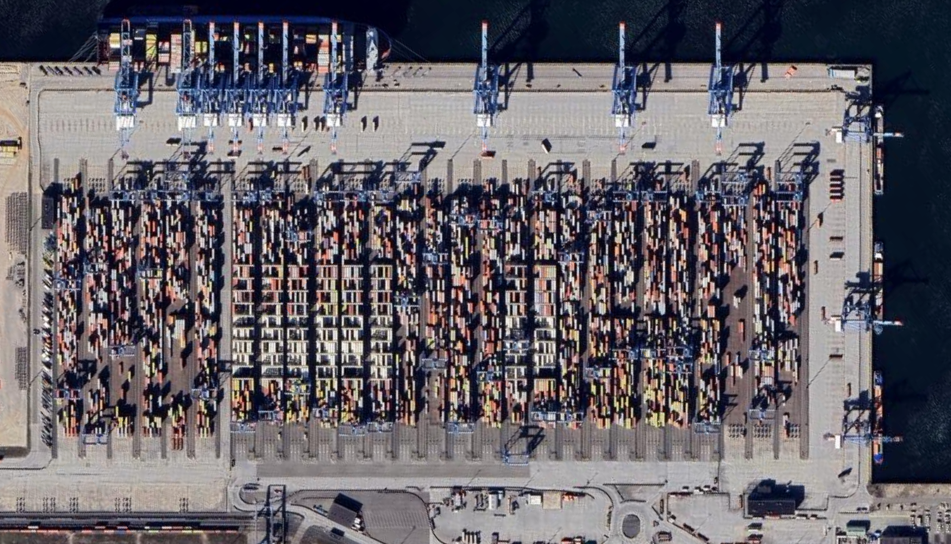 |
At the same time, some terminals have more complicated configuration with containers stored in different direction in different zones of a port (Tab. 3).
Table 3. Examples of complicated container yard configurations
| Port | Container handling system | Example |
| Istanbul | RTG | 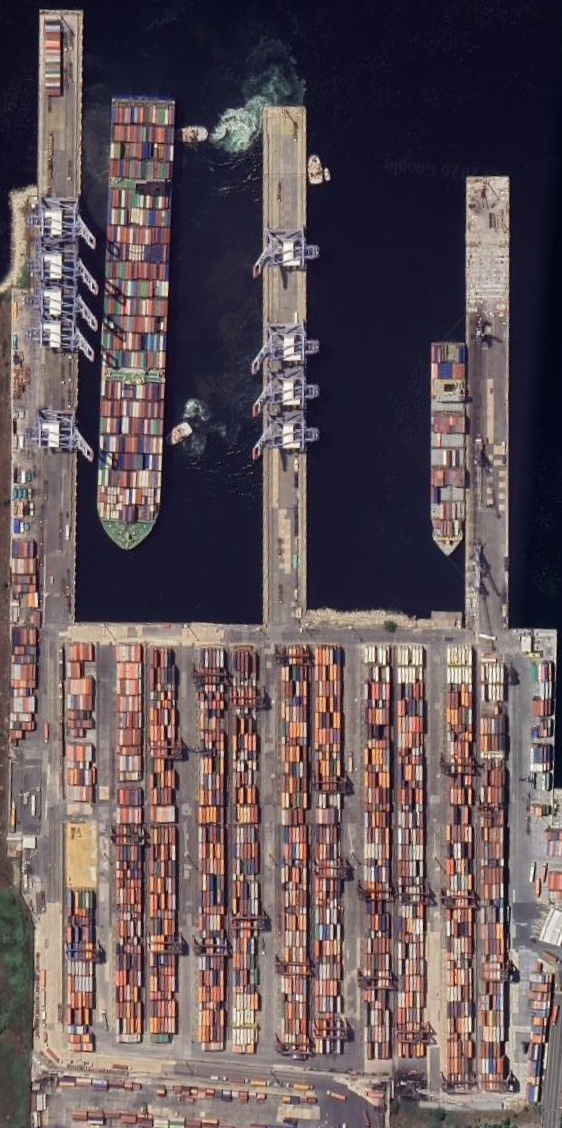 |
| Gotteburg | SC | 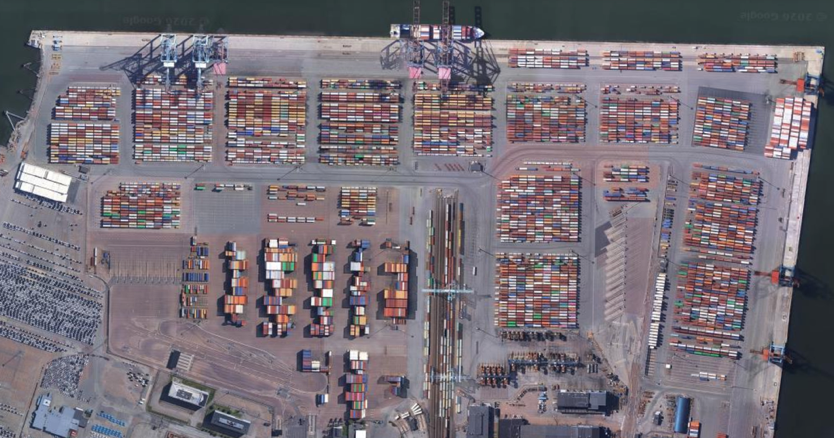 |
| Hai Phong | RS | 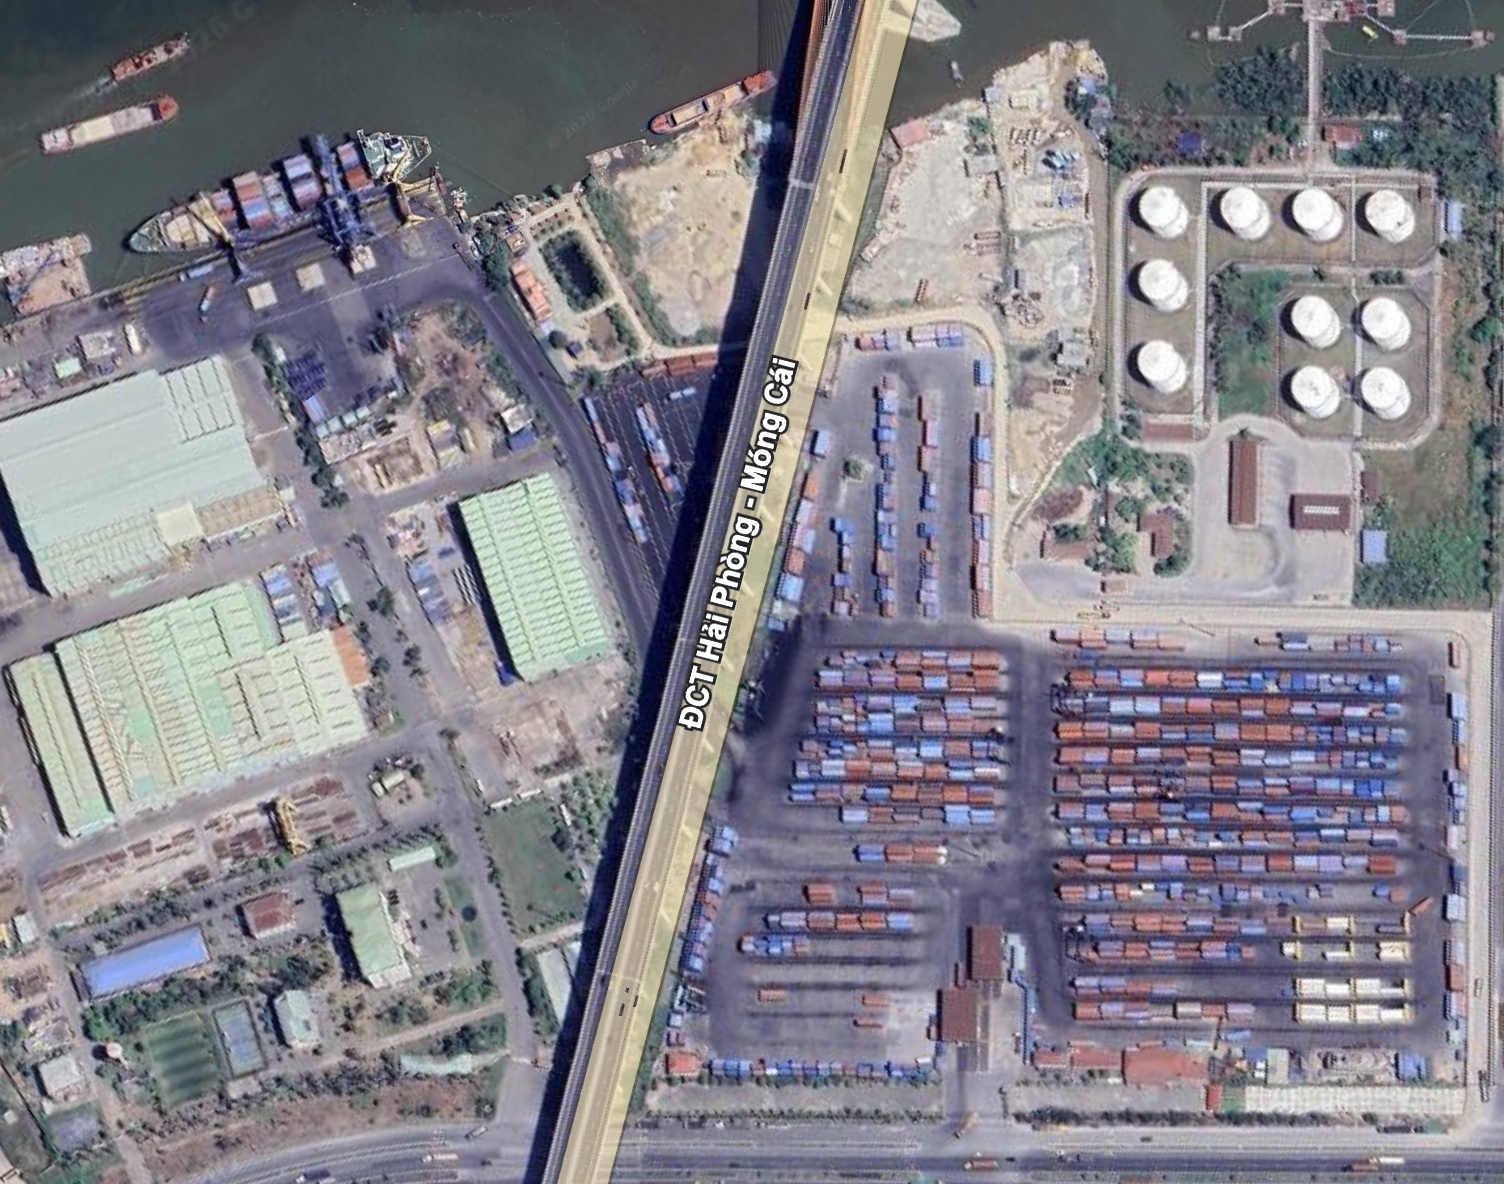 |
| Kuwait | RS | 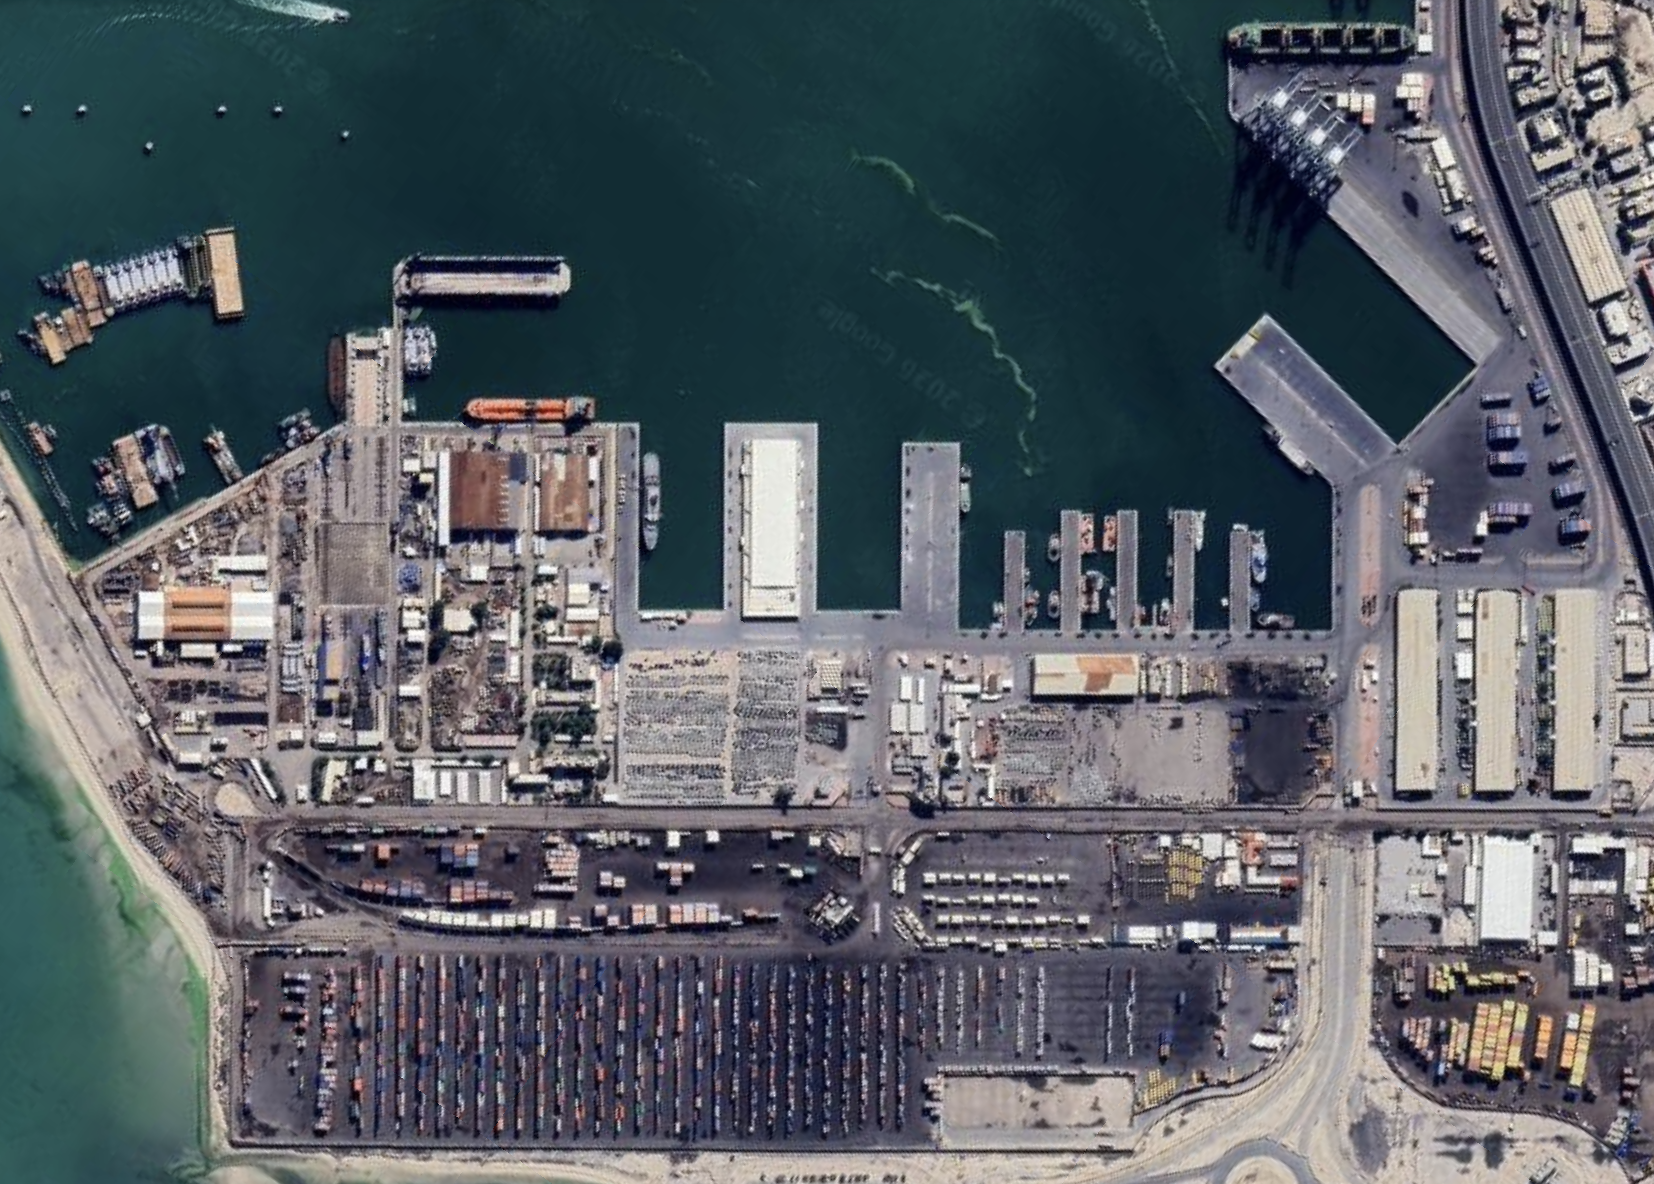 |
Therefore, the suggested parametric model considers:
- container terminals limits;
- different container handling equipment types;
- container yard spacing;
- different variant of container yard direction.
Algorithms
The core of the developed software is computational geometry methodology [12].
The developed software considers two models: with simple and complicated configuration.
Simple container yard configuration algorithm considers only one direction of container stacks. The input data of the algorithm are terminal limit, container handling equipment and existing buildings.
Before considering stack generation, the algorithm builds offset terminal limits (Fig. 6).
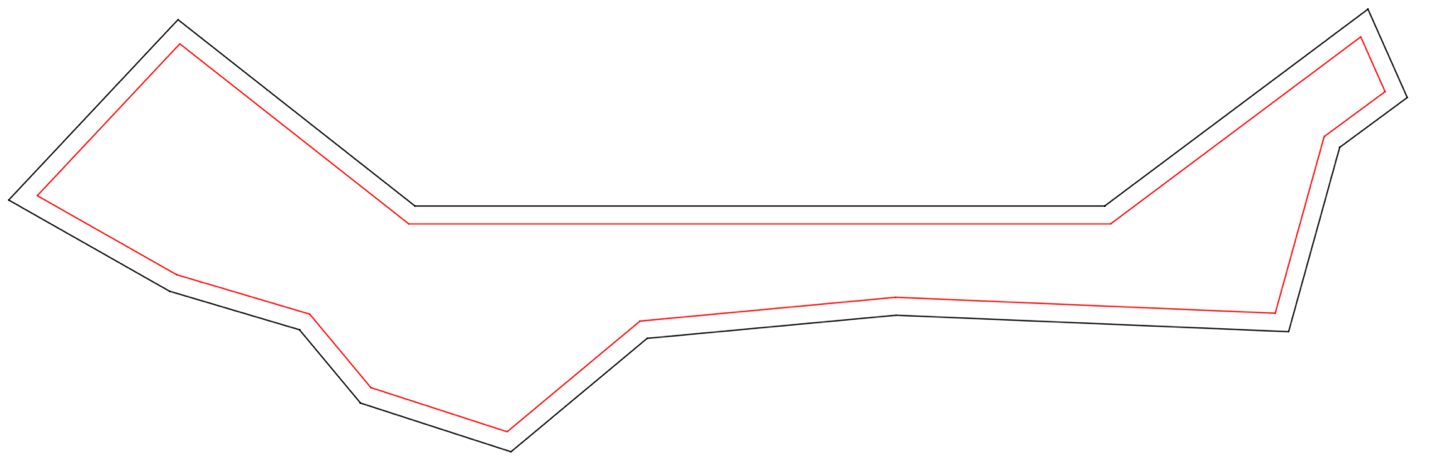
The algorithm considers every segment of terminal limits and builds parallel segments. The distance between parallel lines is equal to distance necessary for container terminal placing and container handling equipment safe work (Fig. 7).
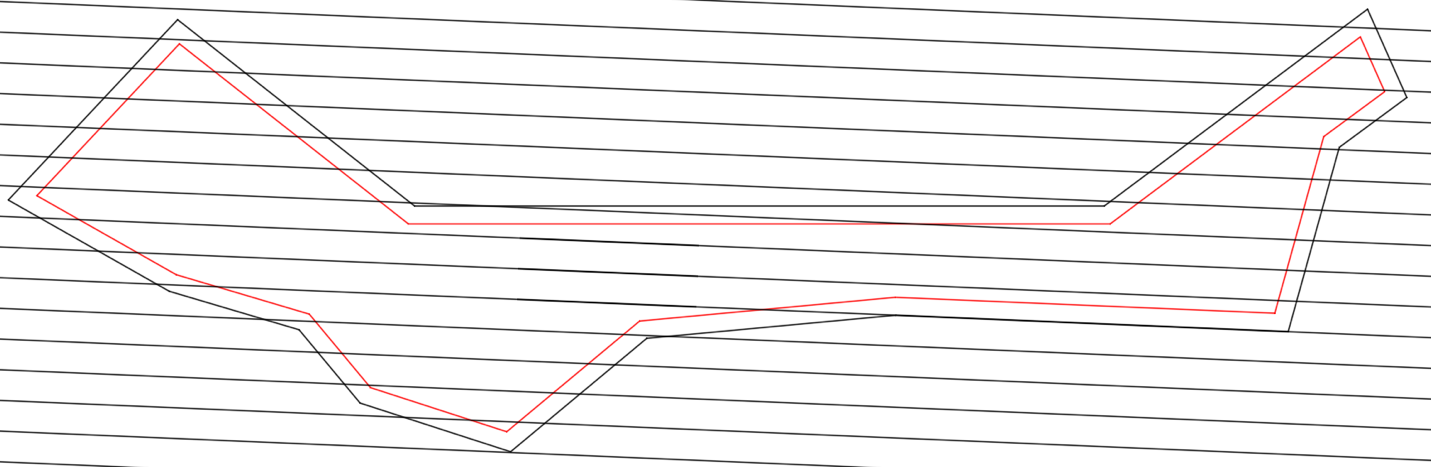
These lines will represent container stacks. Then perpendicular lines are generated to include transport equipment passage roads (Fig. 8).
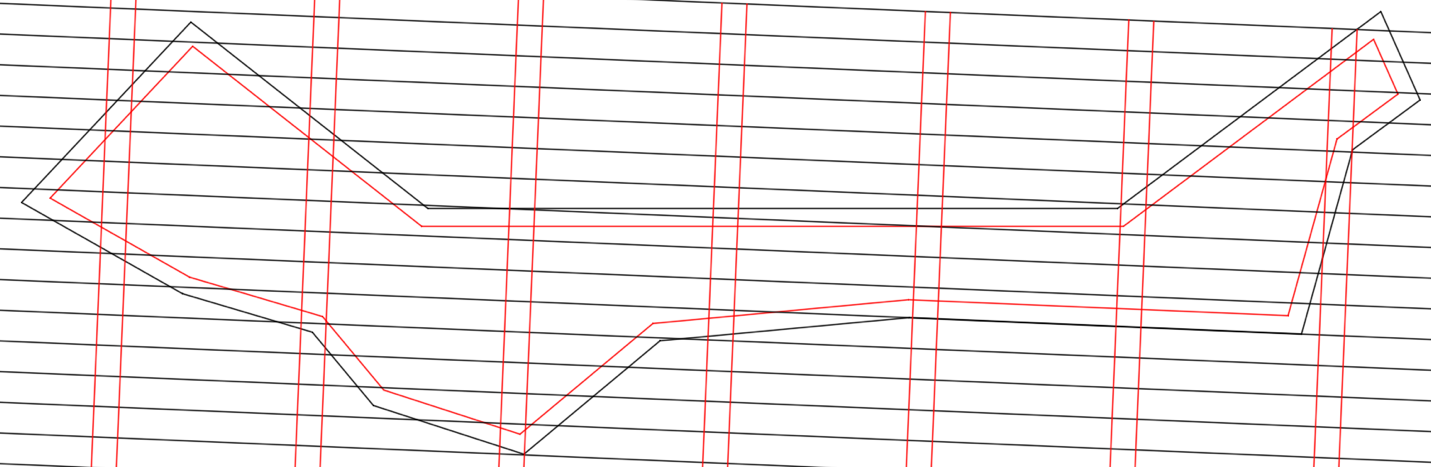
The distance between perpendicular lines is variable. The distance is longer, if the lines will represent a stack, and short, if it will represent transport passage.
When the lines are generated, the algorithm looks for intersections between terminal limits and parallel lines. For each found segment the algorithm checks if it is within the terminal limit or outside [13]. After that the algorithm looks for the segments separated by the perpendicular lines (Fig. 9).
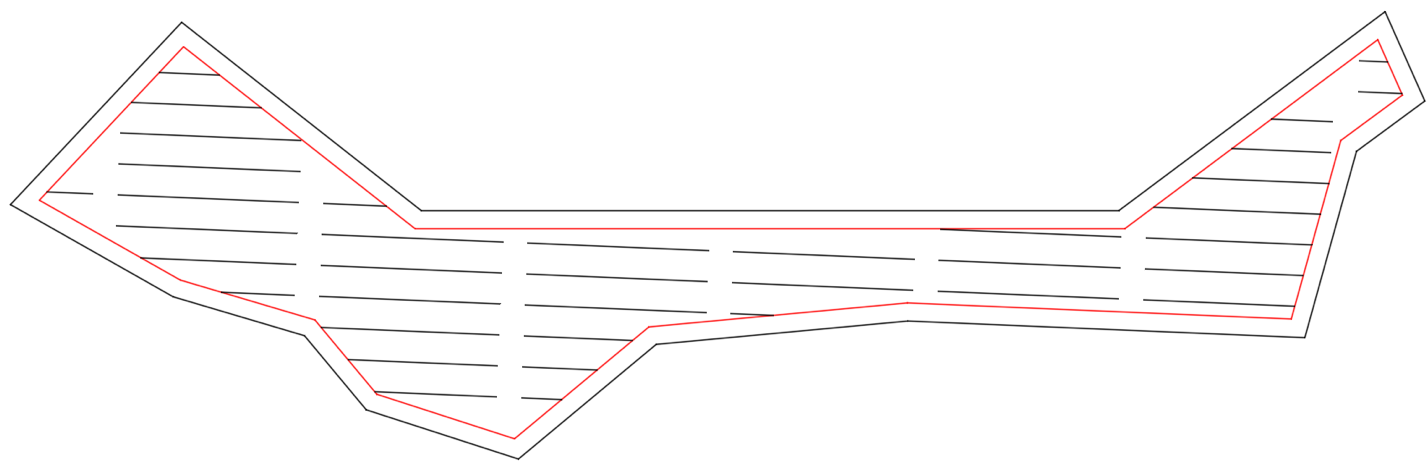
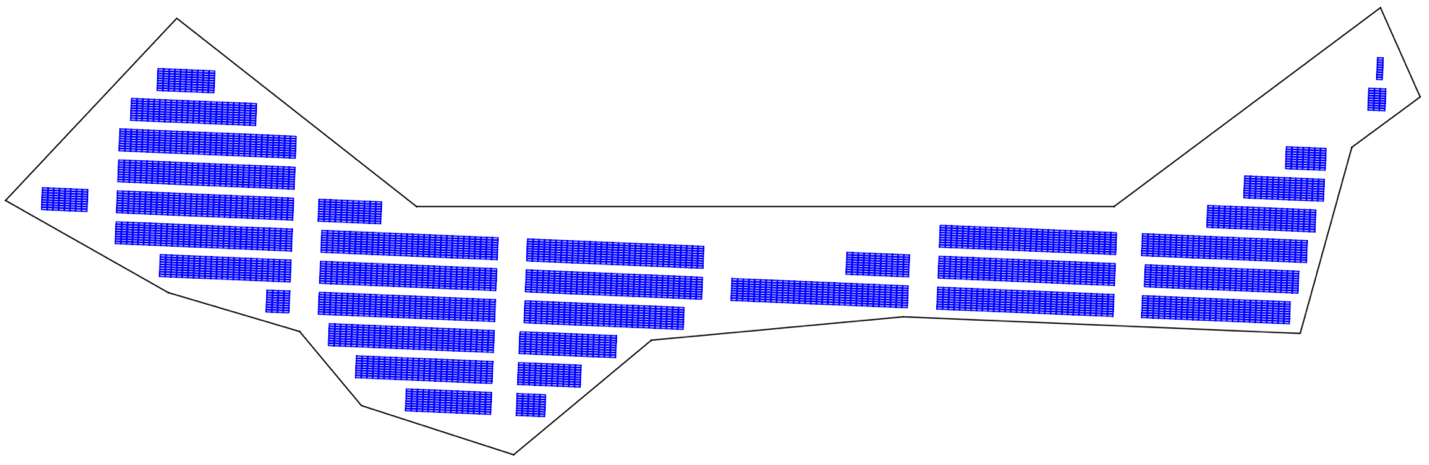
After that for each segment a container stack is drawn. A container stack is drawn bay by bay in order to additionally check if a bay is within the terminal limits and does not intersect with existing building. Result of generation is represented in Fig. 10.
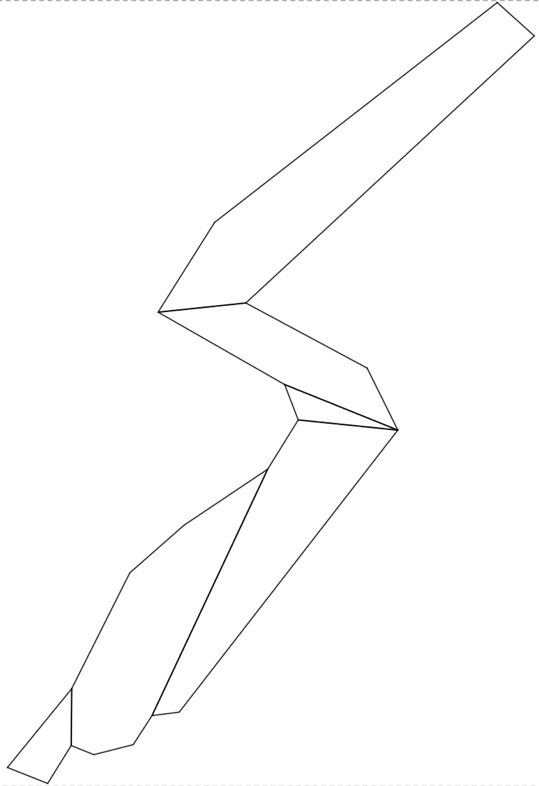
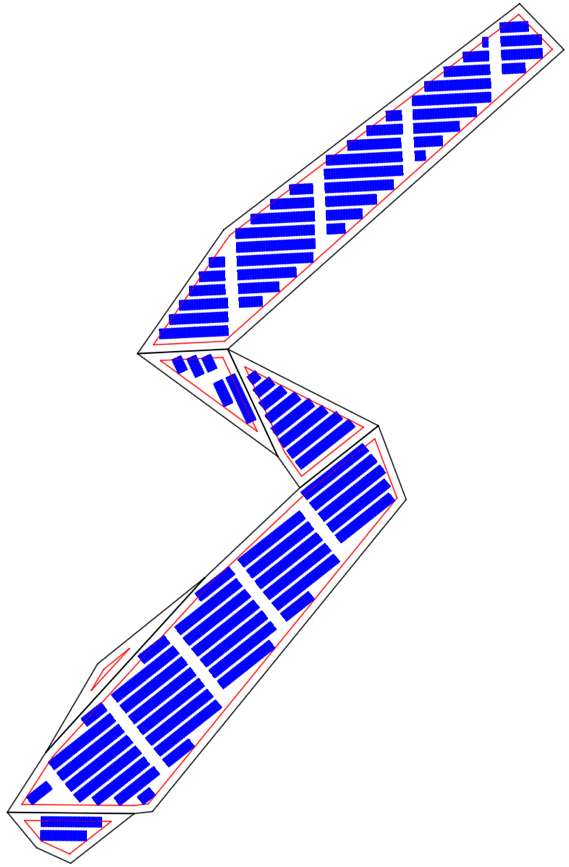
Complicated container yard configuration algorithm considers different direction of container stacks for separate container terminal areas. This program uses polygon decomposition algorithm for find sub-polygons within terminal limits [14]. An example of sub-polygons decomposition is represented in Fig. 11.
After that, for each polygon the algorithm for generation of simple container yard configuration is run. The result container yard configuration is a choice of selected container stack orientations (Fig. 12).
The described algorithms allow to solve several port design problems:
- compare different container handling systems;
- calculate optimal container yard configuration;
- calculate optimal number of perpendicular passages.
The result of the algorithms is a list of possible configurations of a container yard for a certain terminal area (Fig. 13).
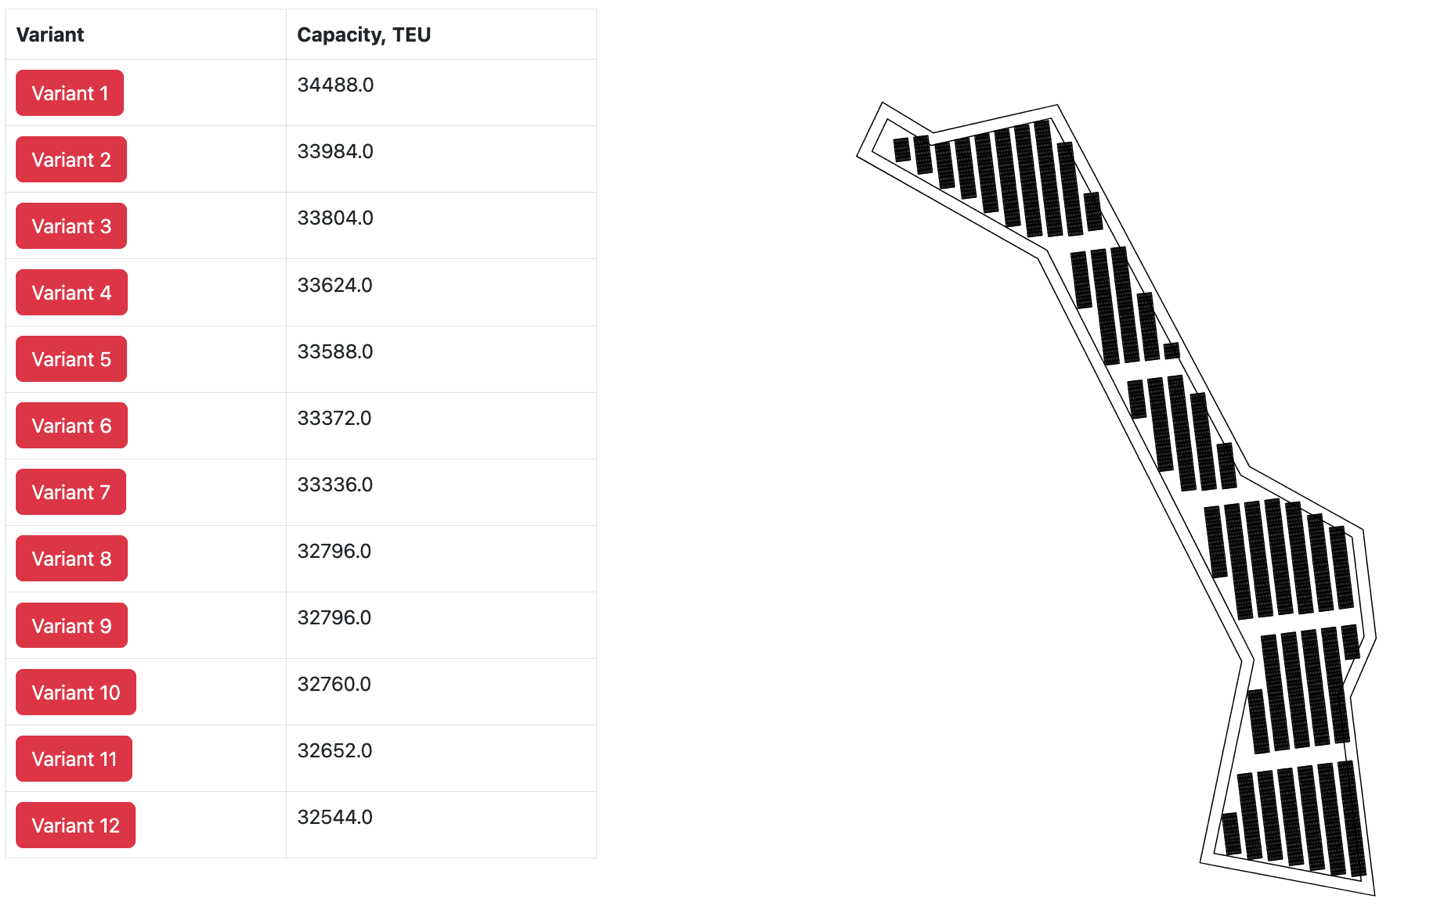
In order to find optimal solution this list must be sorted according to a certain parameter.
How to compare
List sorting can be done according to several parameters:
- storage yard capacity: different variants of container yard configuration supply different storage capacity. This parameter is calculated according to the generated plan: the software calculates the total number of terminal ground slots (TGS) and multiplies it on maximum storage height and maximum stack utilization factor;
- number of storage yard equipment;
- number (or productivity) of terminal transport equipment.
The last two parameters require simulation modelling for a comprehensive analysis and will be covered in a separate article. However, they are ones of the most important parameters of container yard configuration, which define the capital (in the terms of investment to a container terminal handling equipment) and operational (in the terms of existing equipment utilization and productivity) expenditure.
If the stack configuration leads to the impossibility for a container handling equipment to move between stacks, then it will require additional equipment and as a result – additional costs.
If the perpendicular passages are rare, then terminal transport equipment will provide lower productivity – and therefore, less throughput, more operational costs.
Therefore, the selection of optimal container yard configuration requires analysis of different stack directions and equipment utilization.
Current software implementation uses storage yard capacity for list sorting.
Interface description
The first page of the software asks to input project name and terminal limits (Fig. 14).
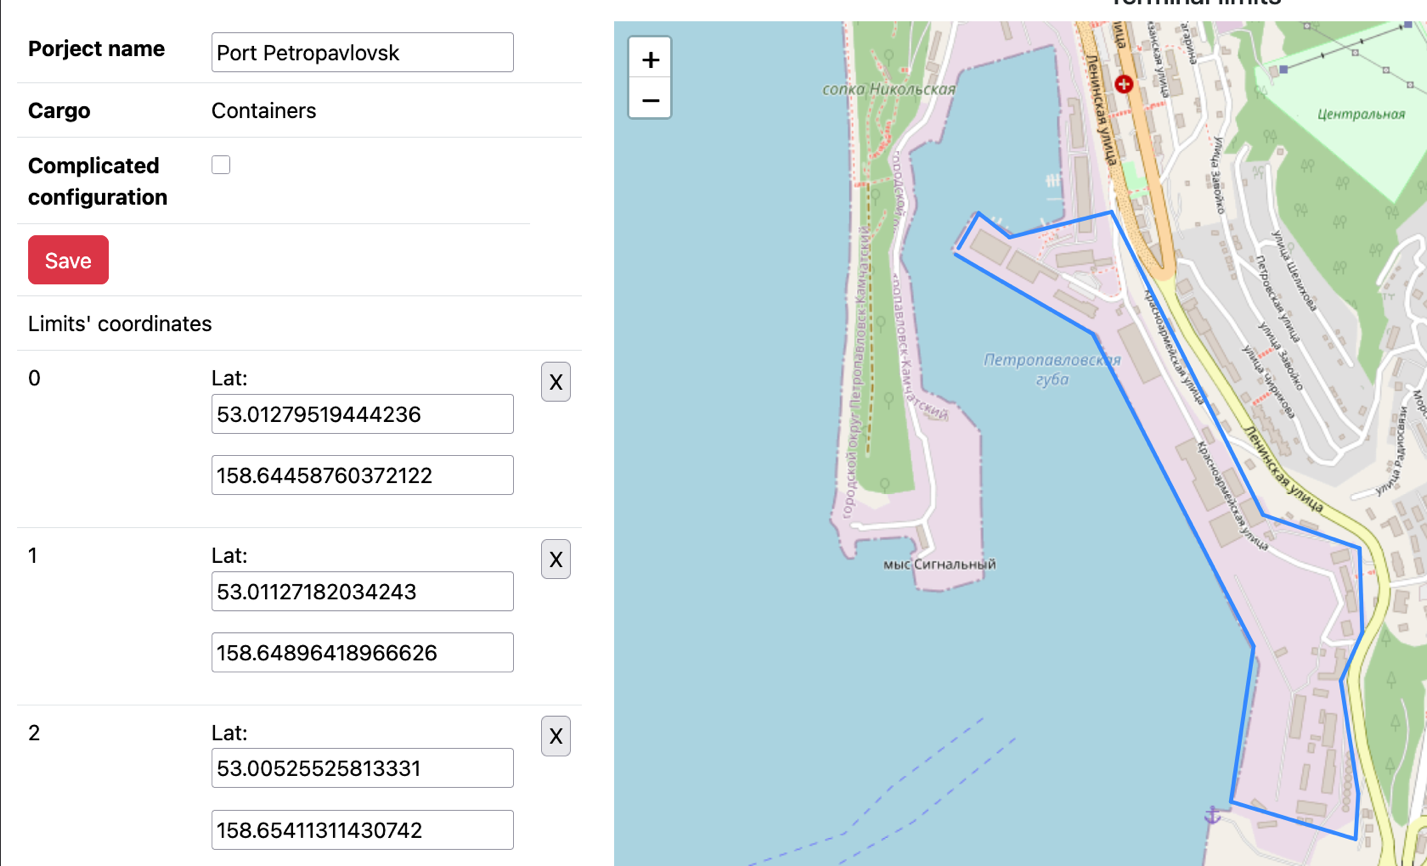
Conceptually, the algorithm is able to work with raw data on terminal limits. This screen was created for the demonstration purposes mainly.
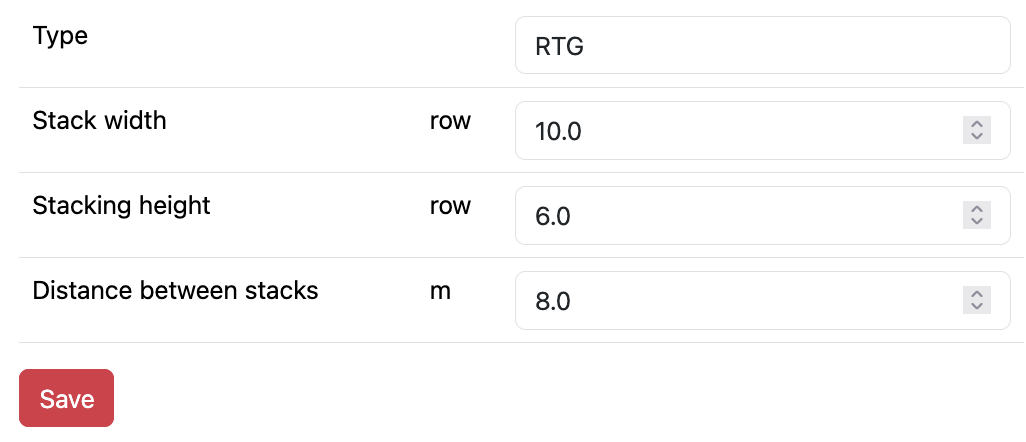
After that a container handling system is chosen. The interface allows to tune the stack parameters, including stack width and height, aisle width, distance among containers (Fig. 15).
Next step is to add existing buildings so that no container is stacked there (Fig. 16).
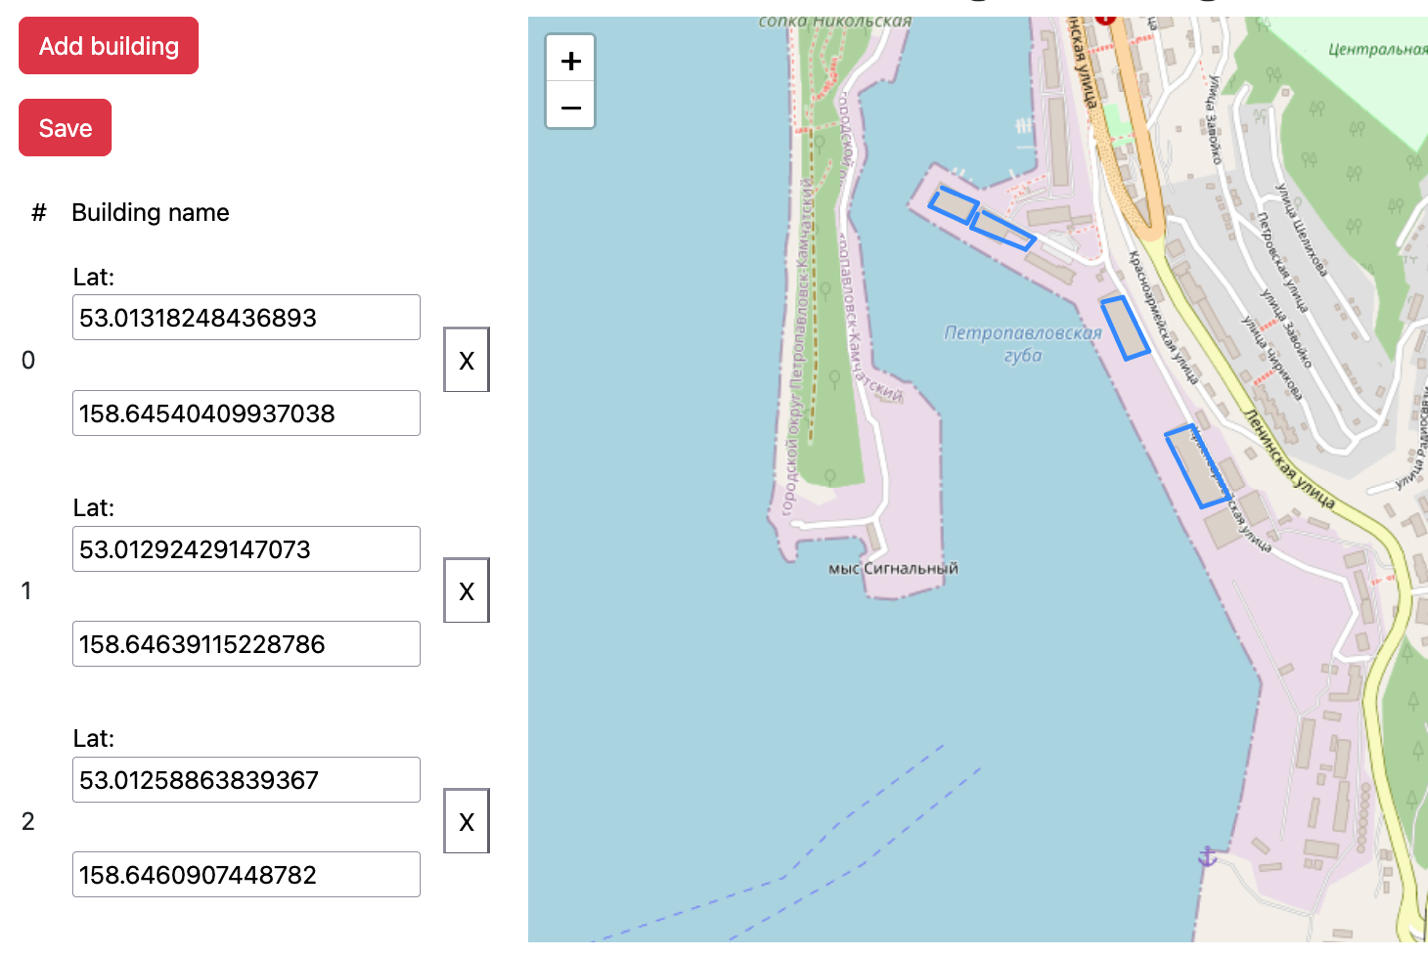
The results are presented as a list of container yard configuration variants, general layout of container yard and three-dimensional model of container yard (Fig. 17-18).
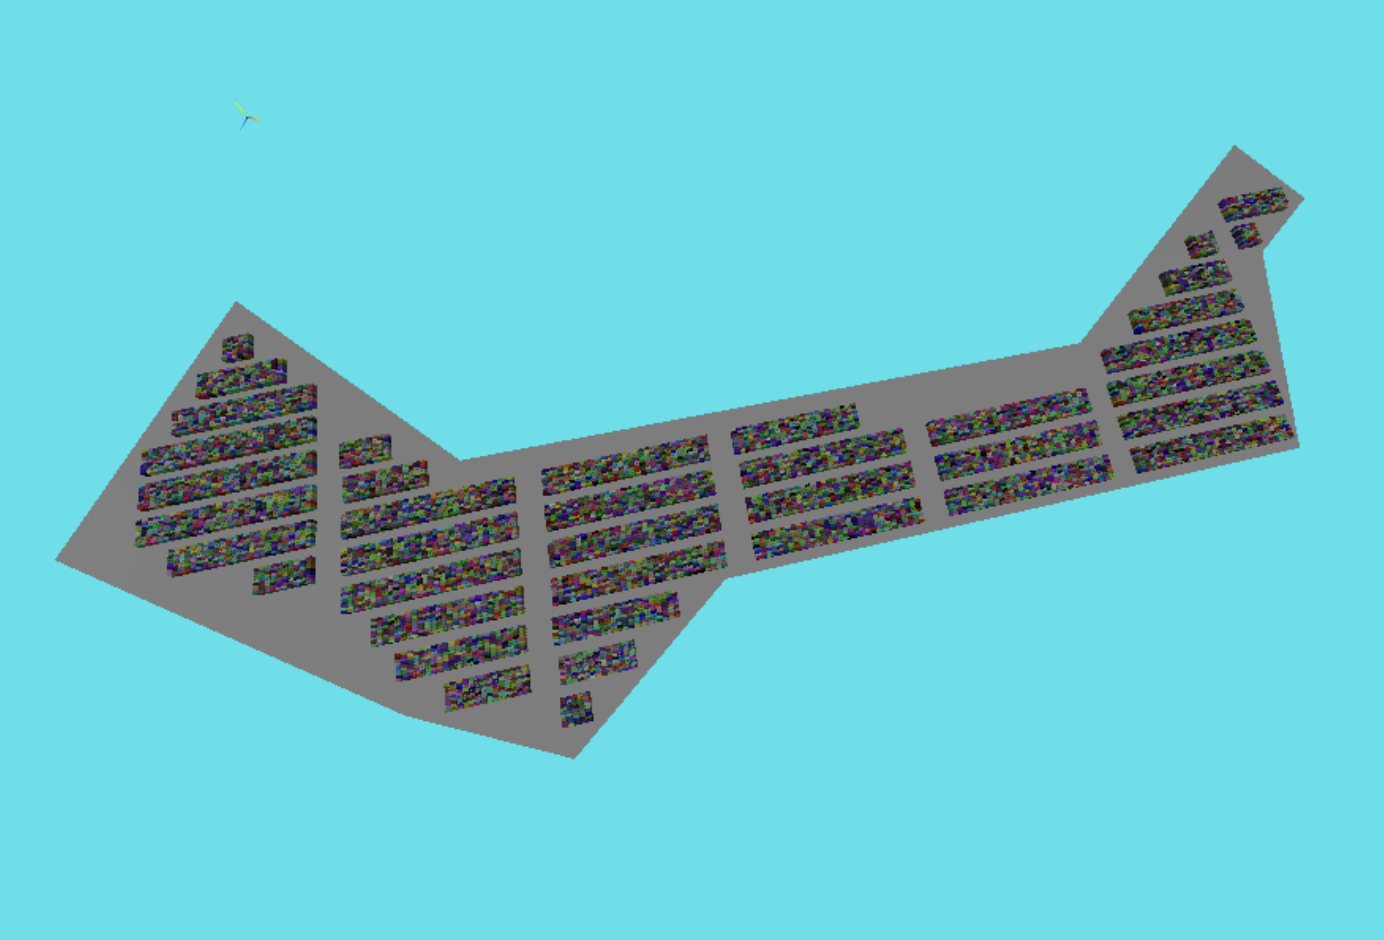
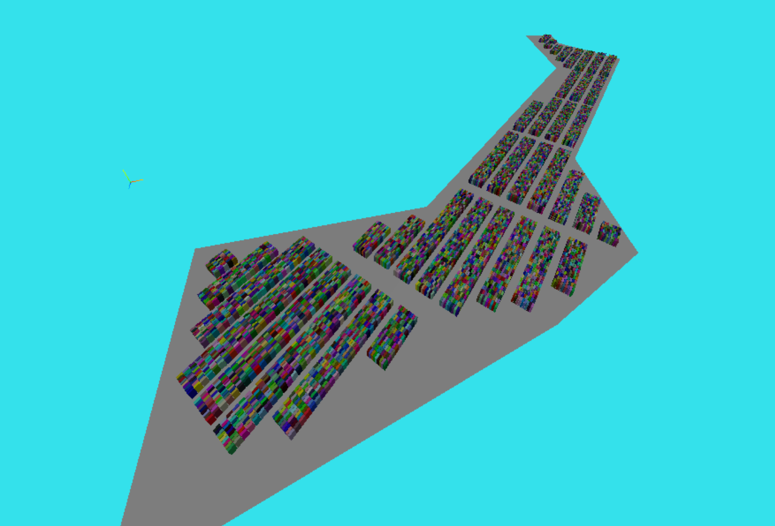
The technical drawing are exported to DXF file format, three-dimensional model – to GLTF.
Conclusions
This article presents a parametric model for container yard generation based on computational geometry. The developed software automatically generates container yard configurations for both simple and complex terminal layouts, accounting for terminal boundaries, handling equipment type, spacing requirements, and existing buildings. The model enables comparison of configurations by storage capacity, and outputs results as technical drawings in DXF format and three-dimensional models in GLTF format. The current implementation focuses on geometric and capacity optimisation. Equipment count and operational productivity analysis, which require simulation modelling, will be addressed in a subsequent publication.
References
- Gharehgozli A., Zaerpour N., de Koster R. Container terminal layout design: transition and future //Maritime Economics & Logistics. – 2020. – V. 22. – №. 4. – p. 610-639.
- Wiese J., Suhl L., Kliewer N. An analytical model for designing yard layouts of a straddle carrier based container terminal // Flexible Services and Manufacturing Journal. 2011. V. 25. № 4. p. 466-502.
- Dahal K., Galloway S., Hopkins I. Modelling, simulation and optimisation of port system management //International Journal of Agile Systems and Management. – 2007. – V. 2. – №. 1. – p. 92-108.
- PIANC. MarCom WG 185. Ports on Greenfield Sites – Guidelines for Site Selection and Masterplanning, 2019, p. 134.
- PIANC. MarCom WG 158. Masterplans for the development of existing ports. 2014. p. 230.
- Theo Notteboom, Athanasios Pallis and Jean-Paul Rodrigue (2026) Port Economics, Management and Policy, 2nd Edition, New York: Routledge, 734 pages / 232 illustrations. ISBN 9781032955339. URL: https://porteconomicsmanagement.org/pemp/contents/part6/container-terminal-design-equipment/conventional-automated-container-terminal-configurations/
- PIANC. MarCom WG 135. Design Principles for Small and Medium Marine Container Terminals, 2014, p. 135
- Kuznetsov A. L. Maritime container transportation / Kuznetsov A.L., Kirichenko A.V., Solyakov O.V., Semenov A. D. / MORKNIGA. Moscow. 2019. P. 412.
- Google Earth. URL: https://earth.google.com/web/
- Thoresen C. A. et al. Port designer's handbook. – London, UK : Thomas Telford, 2010. – p. 310
- UNCTAD. Port design for developing countries. 1985. P. 243
- De Berg M. et al. Computational geometry: introduction //Computational geometry: algorithms and applications. – Berlin, Heidelberg : Springer Berlin Heidelberg, 2008. – P. 1-17.
- Preparata F. P., Shamos M. I. Computational geometry: an introduction. – Springer Science & Business Media, 2012.
- Pievatolo A., Green P. J. Boundary detection through dynamic polygons //Journal of the Royal Statistical Society: Series B (Statistical Methodology). – 1998. – Т. 60. – №. 3. – С. 609-626.