Introduction
How many Ship-to-Shore (STS) cranes are too many? There are several approaches to calculating the number of quay cranes that should be placed on a quay line. One approach is to divide the terminal’s annual cargo flow by the crane’s annual productivity, taking into account the required quay availability level. Another is to match the number of cranes to the requirements of the design vessel. However, these methods can lead to excess crane allocation, driving up both capital and operational expenditure.
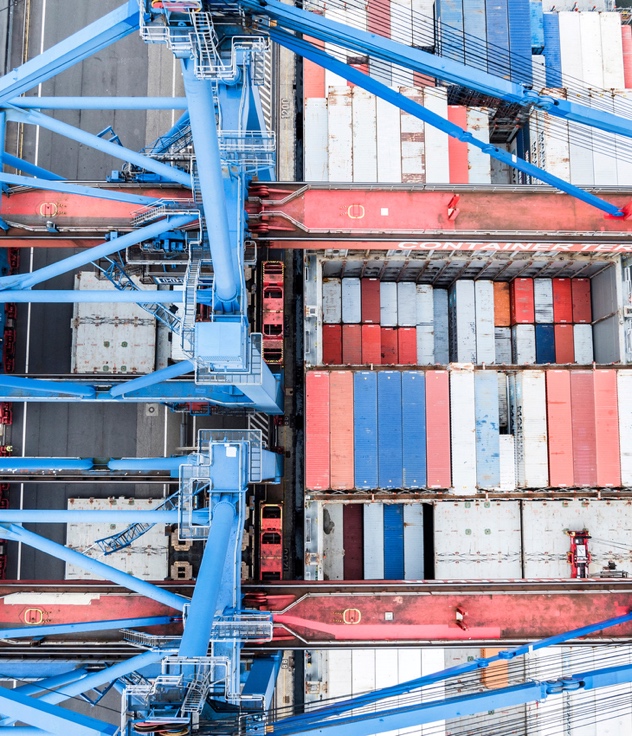
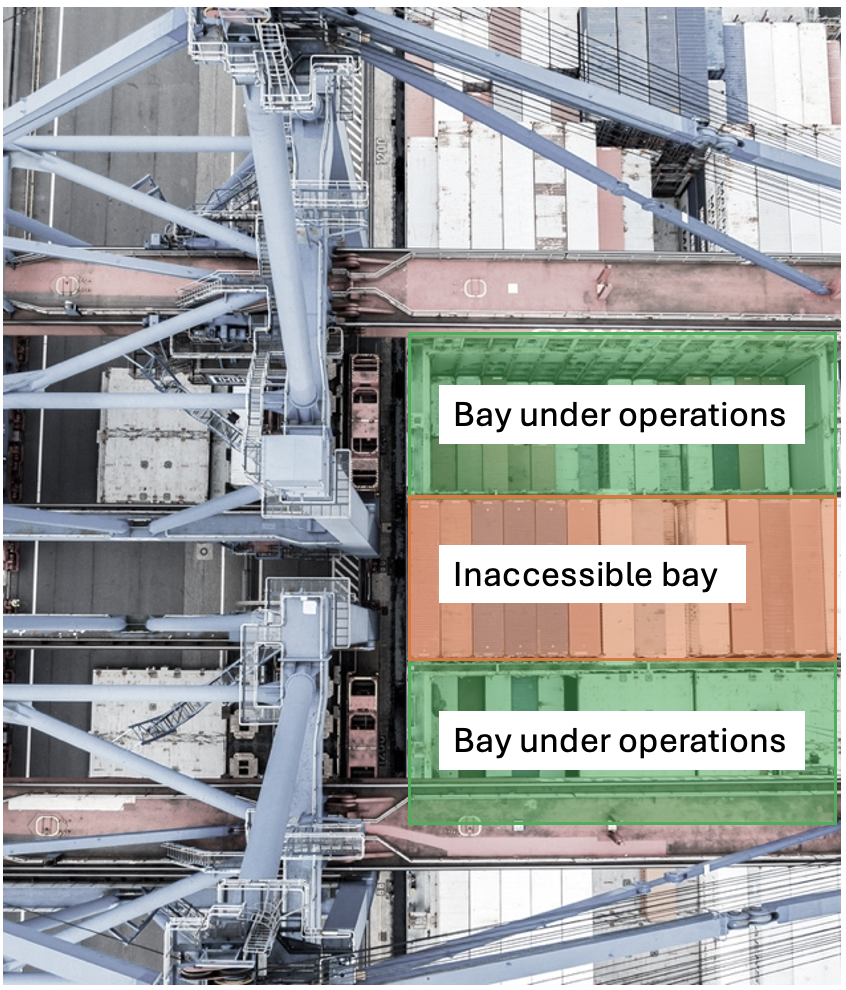
Too many cranes on the quay line will lead to their lower utilization, since two cranes, working behind each other cannot handle containers within two adjacent bays (Fig. 1).
 |
 |
Analysis of world benchmarks shows that average quay length for one crane is 95 meters (Fig. 2).
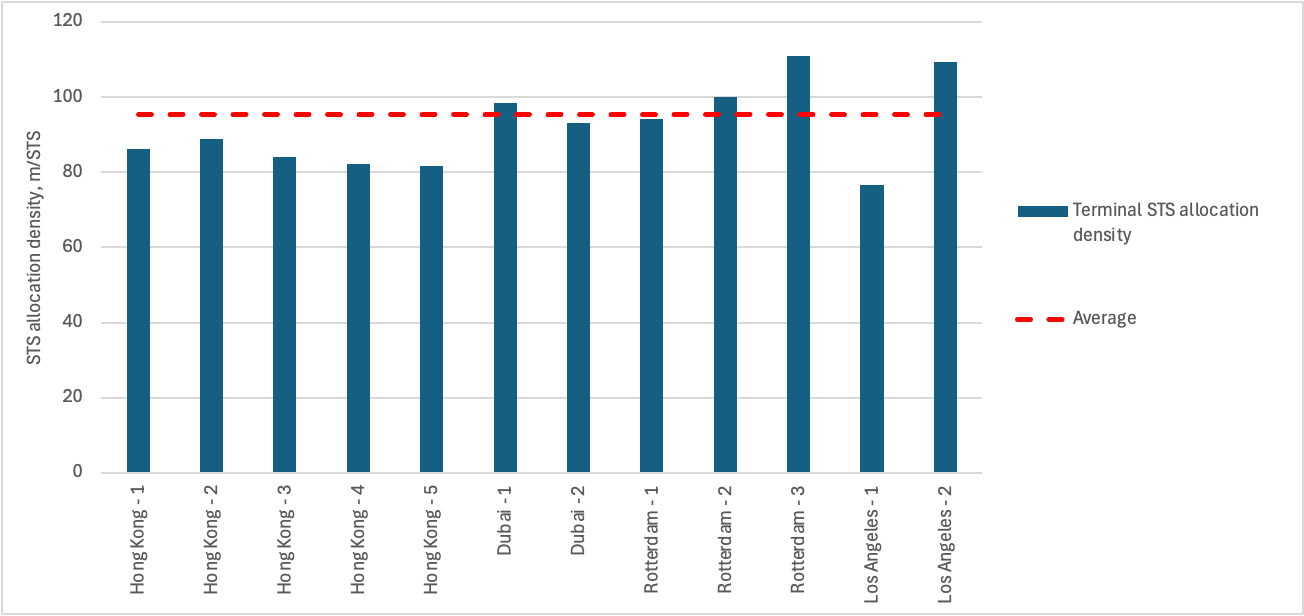
Therefore, the number of cranes must be chosen in the relation to the quay line. At the same time, given the variations in ship dimensions, the irregular nature of vessel calls and ship call sizes, a simple algebraic approach cannot adequately capture the complexity of STS operations.
Mathematical constraints
The analysis requires definition of key constraints that define the number of cranes, allocated on a quay. First of all, the minimum and maximum number of cranes that can be allocated on a ship is defined by the allowable crane travel distance and the number of ships’ bays. Crane travel distance is primarily defined by the length of electrical cable and the position of power connectors. Since this length can be selected during the port design stage, the minimum number of cranes that can be located on a ship is one.
The maximum number of cranes is defined as:
\( N=⌊\frac{B}{b_{sts}+1}⌋ \)
where \( B \) – number of ships’ bays;
\( b_{sts} \) – the minimum number of bays between two cranes (for STS cranes it is equal to 1, and for portal crane is at least 2).
The maximum number of STS cranes that can be located on different types of ships is represented in Tab. 1.
Table 1. Maximum number of STS, that can be located on a ship
| # | Ship Type | Capacity, TEU | Number of bays | Maximum number of STS cranes |
|---|---|---|---|---|
| 1 | Small Feeder | 1 000 | 8 | 4 |
| 2 | Feeder | 2 500 | 10 | 5 |
| 3 | Panamax | 4 500 | 17 | 8 |
| 4 | Post Panamax | 6 000 | 20 | 10 |
| 5 | Post Panamax II | 8 500 | 23 | 11 |
| 6 | VLCS | 15 000 | 23 | 11 |
| 7 | New-Panamax | 12 500 | 22 | 11 |
| 8 | ULCS | 21 000 | 24 | 12 |
The minimum and maximum number of cranes allows us to calculate theoretical cargo handling time:
where \( V_{call} \) – ships’ call, TEU;
\( n \) – number of cranes;
\( P_{sts} \) – STS productivity, TEU/hour.
The relations between number of cranes and cargo handling time are represented in Fig. 3.
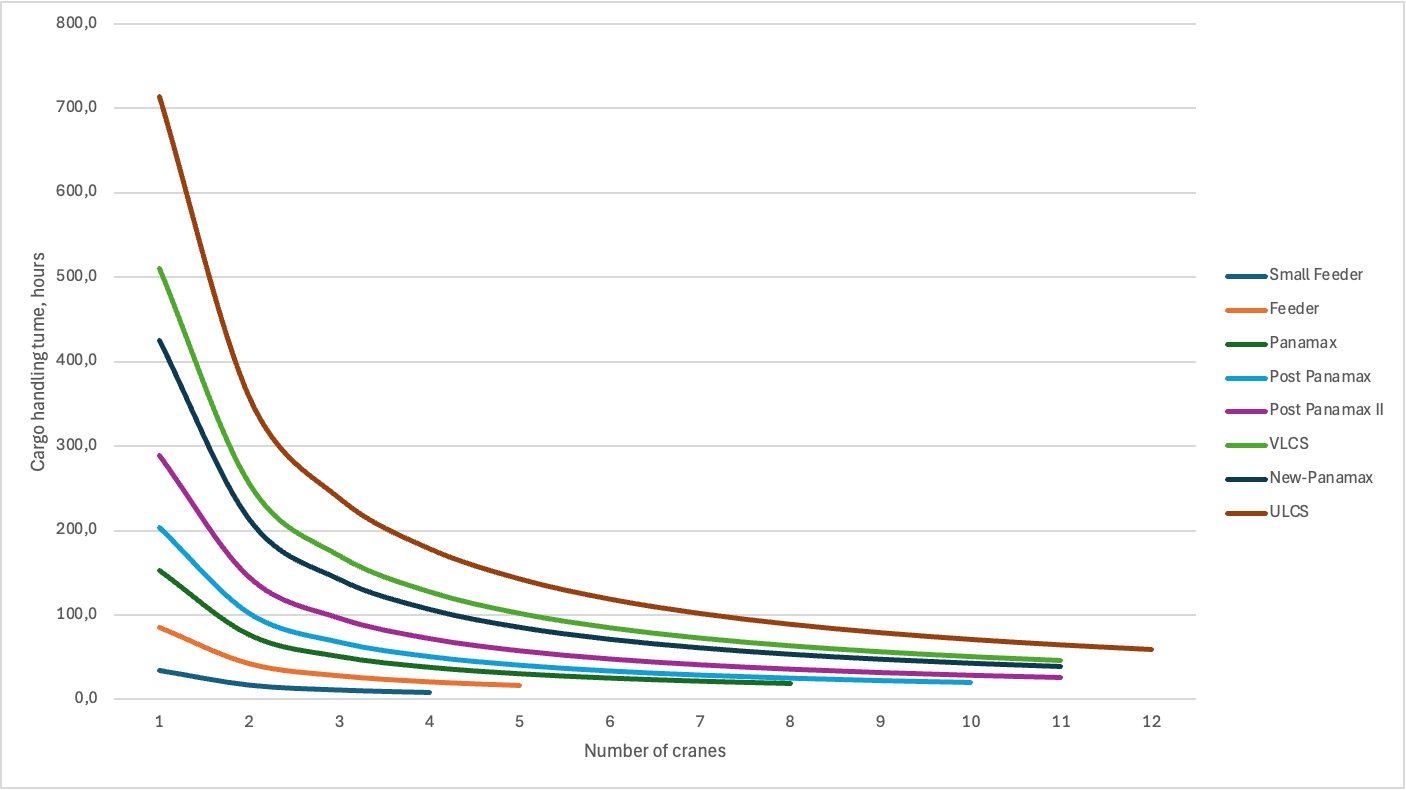
At the same time, the theoretical cargo handling time does not consider, how many bays a crane serves. Therefore, the calculated time is an idealistic picture. More profound approach is to consider container allocation on a ship as an array (Fig. 4).
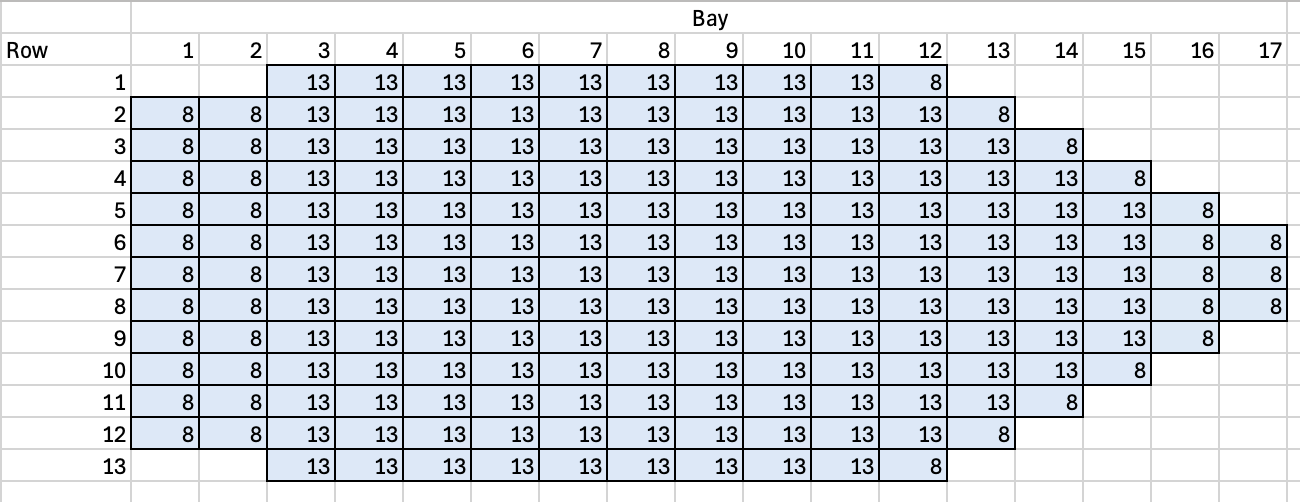
The elements of array represent the number of containers in a certain bay and row. This array is split among cranes working on a ship. The sub-arrays represent the number of containers that are served by a crane. An example of such split is represented in Fig. 5.
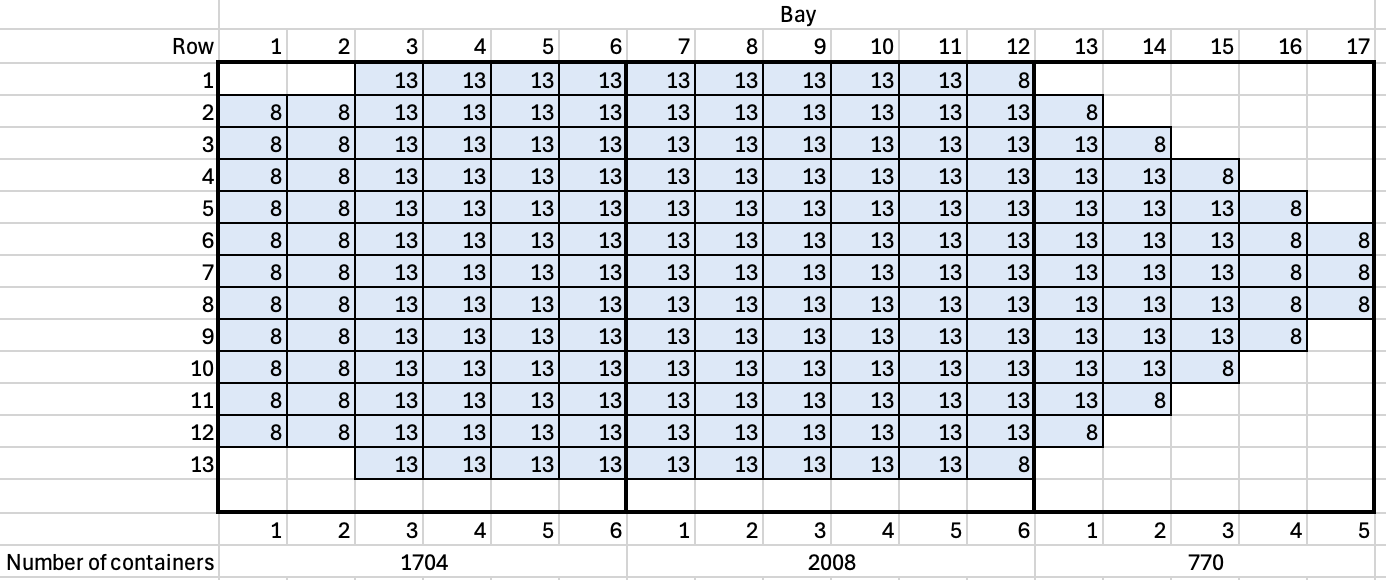
Since STS cranes are working simultaneously, the cargo handling time is defined by the “slowest” STS crane – the one that needs to unload more containers. Therefore, the formula should be changed to:
\( T_{handl}=\underset{}{max}{{T_{handl}^{i}}}=\underset{}{max}{\left\{\frac{V_{handl}^{i}}{P_{sts}}\right\}} \)
where \( V_{handl}^{i} \) – is the number of containers, that must be served by a crane i.
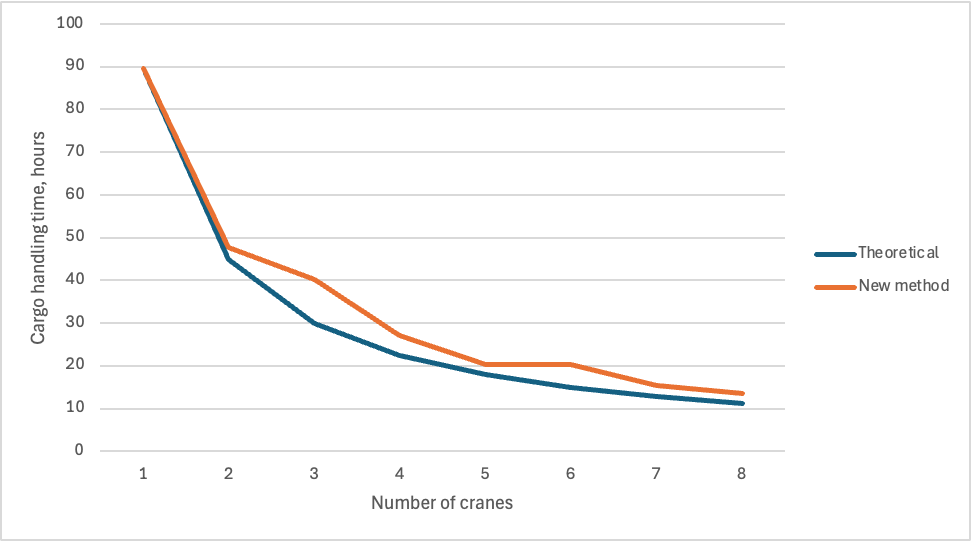
An example of cargo handling time calculation, using this method for a Panamax ship is represented in Fig. 6.
At the same time, such approach does not allow to analyze crane utilization for two adjacent quays. Therefore, simulation model is developed to analyze it.
Simulation modelling
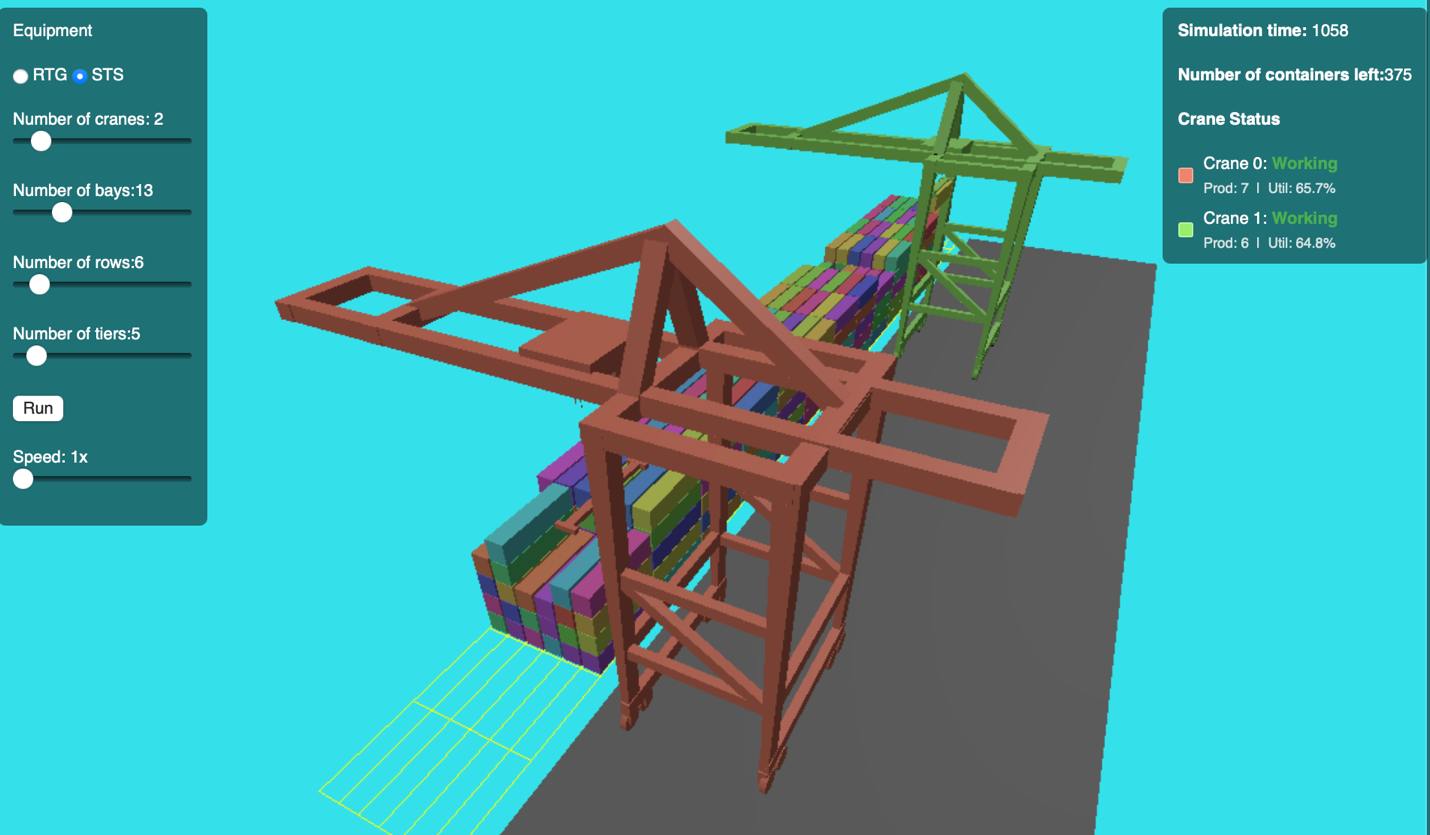
The model takes the number of quay cranes and ship characteristics — including number of bays, rows, tiers, and call size — as inputs. It simulates quay cranes loading and unloading vessels that visit a container terminal. Cranes work through each ship’s bays in sequence while accounting for the positions of other cranes. When a crane cannot access its next required bay, it waits until the path is clear. The loading and unloading order is randomised to reflect the complexity of real-world cargo handling operations.
Each crane’s working sector can be limited by cable reel distance, reflecting real operational constraints. The model also includes three-dimensional animation, which can be used to verify the algorithm and communicate results to stakeholders (Fig. 7).
The model produces calculated of quay crane productivity, utilization and container handling time. The charts below illustrate results from a simulation of a two quays, handling up to two vessels with 4 334 TEU capacity (Fig. 8–10).
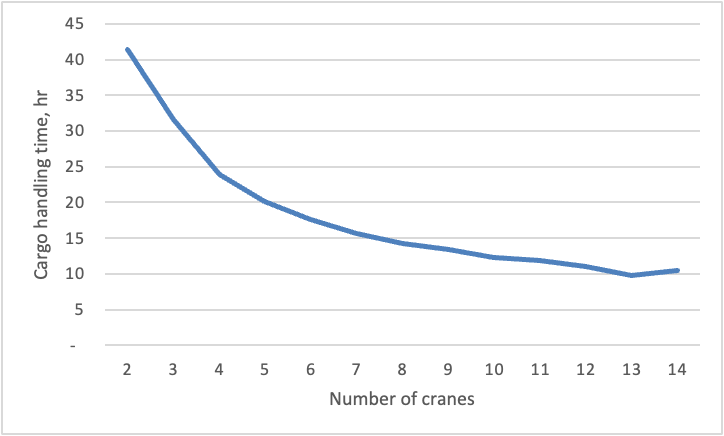
Figure 8. An example of ships’ cargo handling time in relation to the number of cranes
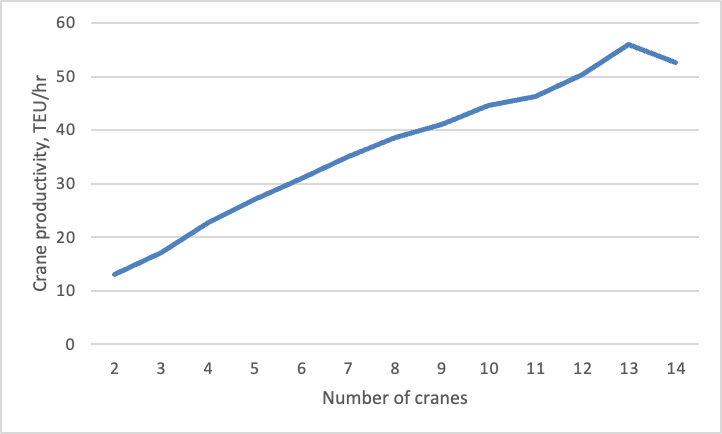
Figure 9. An example of quay productivity in relation to the number of cranes
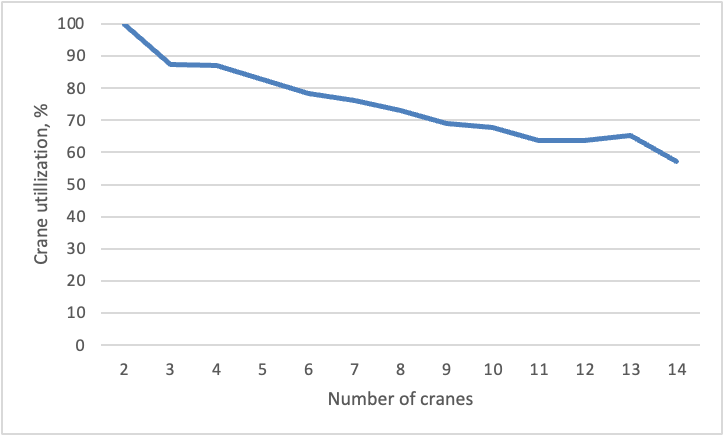
Figure 10. An example of quay crane utilization in relation to the number of quays
As it is seen from the figures, when too many cranes are placed on the quay line, the crane productivity drops down. Moreover, allocation of more cranes on the same quay line leads to the inability to implement all necessary cargo operations.
Conclusion
The results show that the actual crane productivity is quite far from the theoretical calculations. At the same time, the form of relations is similar, no anomalies were revealed. Therefore, the number of cranes can be selected purely from a project’s key performance indicators, including annual cargoflow and ships’ service time.
The described approach offers terminal planners a practical tool for making data-driven decisions about crane allocation on quay line. Rather than defaulting to algebraic rules or over-provisioning “just in case,” operators can test different configurations and identify the point at which additional cranes stop paying for themselves. The result is a leaner, more cost-effective terminal design — without sacrificing service quality.